
Advanced Search

Advanced Search

Current Filters

Filter your query

Publication Types

Other

to

Abstract

  • Goal: Compare health system performance in 10 countries, including the United States, to glean insights for U.S. improvement.
  • Methods: Analysis of 70 health system performance measures in five areas: access to care, care process, administrative efficiency, equity, and health outcomes.
  • Key Findings: The top three countries are Australia, the Netherlands, and the United Kingdom, although differences in overall performance between most countries are relatively small. The only clear outlier is the U.S., where health system performance is dramatically lower.
  • Conclusion: The U.S. continues to be in a class by itself in the underperformance of its health care sector. While the other nine countries differ in the details of their systems and in their performance on domains, unlike the U.S., they all have found a way to meet their residents’ most basic health care needs, including universal coverage.

Introduction

Mirror, Mirror 2024 is the Commonwealth Fund’s eighth report comparing the performance of health systems in selected countries. Since the first edition in 2004, our goal has remained the same: to highlight lessons from the experiences of these nations, with special attention to how they might inform health system improvement in the United States.

While each country’s health system is unique — evolving over decades, sometimes centuries, in tandem with shifts in political culture, history, and resources — comparisons can offer rich insights to inform policy thinking. Perhaps above all, they can demonstrate the profound impact of national policy choices on a country’s health and well-being.

In this edition of Mirror, Mirror, we compare the health systems of 10 countries: Australia, Canada, France, Germany, the Netherlands, New Zealand, Sweden, Switzerland, the United Kingdom, and the United States. We examine five key domains of health system performance: access to care, care process, administrative efficiency, equity, and health outcomes (each is defined below).

Despite their overall rankings, all the countries have strengths and weaknesses, ranking high on some dimensions and lower on others. No country is at the top or bottom on all areas of performance. Even the top-ranked country — Australia — does less well, for example, on measures of access to care and care process. And even the U.S., with the lowest-ranked health system, ranks second in the care process domain.

Nevertheless, in the aggregate, the nine nations we examined are more alike than different with respect to their higher and lower performance in various domains. But there is one glaring exception — the U.S. (see “How We Conducted This Study”). Especially concerning is the U.S. record on health outcomes, particularly in relation to how much the U.S. spends on health care. The ability to keep people healthy is a critical indicator of a nation’ capacity to achieve equitable growth. In fulfilling this fundamental obligation, the U.S. continues to fail.

How We Measured Performance

Our approach to assessing nations’ health systems mostly resembles recent editions of Mirror, Mirror, involving 70 unique measures in five performance domains. The data sources for our assessments are rich and varied. First, we rely on the unique data collected from international surveys that the Commonwealth Fund conducts in close collaboration with participating countries.1 On a three-year rotating basis, the Fund and its partners survey older adults (age 65 and older), primary care physicians, and the general population (age 18 and older) in each nation. The 2024 edition relies on surveys from 2021, 2022, and 2023.

We also rely on published and unpublished data from cross-national organizations including the World Health Organization (WHO), the Organisation for Economic Co-operation and Development (OECD), and Our World in Data, as well as national data registries and the research literature.

Mirror, Mirror 2024 differs from past reports in certain respects:

  • It covers 10 countries instead of the previous 11, after Norway exited the Commonwealth Fund’s international surveys. Norway was the top-ranked country in the 2021 edition of Mirror, Mirror.
  • It accounts for the impact of COVID-19 on health system performance, as we are able to use data collected since the onset of the pandemic and do not use data pre-2020.
  • It investigates several dimensions of equity. In addition to comparisons between residents with above-average and below-average income, this edition examines health system performance differences based on gender (limited to male and female because of insufficient sample size to include additional gender identities) and location (rural and nonrural) as well as patients’ experiences of discrimination, as reported by physicians. Comparisons of performance with respect to race and ethnicity were not possible because of data limitations: many countries do not collect information on these variables and the constructs of identity vary from country to country. To allow for continuity and comparison with previous editions, we present separate analyses for those based only on income and those based on income, gender, and geography combined. Only the analysis based on income was included in our overall rankings. For further detail, see “How We Conducted This Study.”

Health System Performance Overview

Blumenthal_mirror_mirror_2024_exhibit_01_v2
Blumenthal_mirror_mirror_2024_exhibit_02

The United States ranks last overall (Exhibits 1 and 2). The three top-performing countries in 2024 are Australia, the Netherlands, and the United Kingdom.

Readers should use caution in drawing conclusions when comparing countries’ overall performance: each country has areas of higher and lower performance, and all countries have something to learn from one another.

Blumenthal_mirror_mirror_2024_exhibit_03

While health care spending is not a measure of performance in the Mirror, Mirror 2024 rankings, it provides important context for our analysis. The United States is not just an outlier on health system performance; it’s an outlier on health care spending as well. In 1980, U.S. expenditures were at the high end of the distribution among the 10 nations studied, but comparable to outlays in Sweden and Germany (8.2% of GDP). Since then, however, the U.S. has far outpaced other nations, spending more than 16 percent of its GDP on health care in 2022 (Exhibit 3). That figure is predicted to exceed 20 percent by 2035.2 In 1980, the other countries included in this analysis spent between 4 percent and 8 percent of GDP, and had increased spending to between 8 percent and 12 percent by 2023.

Blumenthal_mirror_mirror_2024_exhibit_04

The two countries with the highest overall rankings, Australia and the Netherlands, also have the lowest health care spending as a share of GDP (Exhibit 4). The other countries are clustered closely together — except for the U.S., which spends far more of its GDP on health care yet has by far the worst overall performance.

How Countries Did on Each Performance Domain

Blumenthal_mirror_mirror_2024_exhibit_05

Access to care focuses on the affordability and availability of health services at the population level. The Netherlands, the United Kingdom, and Germany perform best on access overall, and both the Netherlands and Germany rank at or near the top on the two components of affordability and availability (Exhibit 5). The U.K.’s health system is the top one for affordability.

The Netherlands, U.K., and Germany excel on measures of affordability because each country has low cost-related barriers to care, as reported by patients, and minimal out-of-pocket health care expenses. In these countries, universal coverage ensures that copayments for health services, if any, are small, guaranteeing both access and affordability.

In the Netherlands, visits to primary care, maternity care, and child health care providers are fully covered; other health care services are covered once patients pay their annual deductible.3 In the U.K., the National Health Service (NHS) provides free public health care, including hospital, physician, and mental health care.4

In Germany, copayments are capped at a fixed percentage of income — 2 percent of gross income for all patients, and 1 percent for chronically ill patients — above which all care is fully covered.5 In the U.S., the 2024 out-of-pocket limit for marketplace plans under the Affordable Care Act (ACA) cannot be more than $9,450 for single plans and $18,900 for family plans. Our 2023 international survey found that 41 percent of Americans spent $1,000 or more on health care out of pocket in the past year.

Both the Netherlands and Germany have also taken steps to ensure health services are available after regular office hours. In the Netherlands, general practitioners (GPs) must provide 50 hours of after-hours care annually, for which they’re compensated separately (as they also are for house calls).6 The Netherlands also has a system of local and regional GP posts that provide after-hours care and limit the need for emergency room visits. Most GPs are also part of networks that provide care during evenings or weekends. In Germany, physicians are required to offer after-hours care, with regulations varying from region to region.7

Australia, the top performer overall in this report, faired quite poorly when it came to access to care. Roughly half of Australian patients who do not choose to purchase voluntary health insurance may have to wait longer to receive services.8 Affordability is also a noted problem, although new billing incentives have led to improvement in recent years.9

In the U.S., lack of affordability is a pervasive problem. With a fragmented insurance system, a near majority of Americans receive their health coverage through their employer.10 While the ACA’s Medicaid expansions and subsidized private coverage have helped fill the gap, 26 million Americans are still uninsured, leaving them fully exposed to the cost drivers in the system. Cost has also fueled growth of private plan deductibles, leaving about a quarter of the working-age population underinsured. In other words, extensive cost-sharing requirements render many patients unable to visit a doctor when medical issues arise, causing them to skip medical tests, treatments, or follow-up visits, and avoid filling prescriptions or skip doses of their medications.

In terms of care availability, U.S. patients are more likely than their peers in most other countries to report they don’t have a regular doctor or place of care and face limited options for getting treatment after regular office hours. Shortages of primary care services add to these availability problems.

Blumenthal_mirror_mirror_2024_exhibit_06

Care process looks at whether the care that is delivered includes features and attributes that most experts around the world consider to be essential to high-quality care. The elements of this domain are prevention, safety, coordination, patient engagement, and sensitivity to patient preferences. Most notably, the U.S. is among the top performers on care process, ranking second (Exhibit 6). New Zealand is first, with Canada and the Netherlands close behind. Sweden performs comparatively poorly.

Strong U.S. performance in the care process domain is the result of the successful provision of preventive services, such as mammograms and flu vaccinations, and an emphasis on patient safety. With respect to preventive care, the U.S. record might reflect the vigorous pay-for-performance policies implemented by Medicare and other payers to reward the delivery of these services.11

A concerted focus in the U.S. on patient safety since the beginning of the century has yielded significant reductions in adverse events during hospital stays for heart attack, heart failure, pneumonia, and major surgeries between 2010 and 2019.12

Other high performers in care process are New Zealand and the Netherlands. In New Zealand, primary health organizations provide incentive payments to GPs for meeting targets for disease screening, follow-ups, and vaccinations.13 The Netherlands’ strong primary care system may explain its excellence on measures like quality of patient interactions, continuity of care, and physicians’ knowledge of personal situations. Nearly all Dutch citizens (95%) choose and register with a GP, and they are able to switch GPs at their discretion.14

Blumenthal_mirror_mirror_2024_exhibit_07

Administrative efficiency focuses on measures of the challenges doctors have in dealing with insurance or medical claims issues; requirements for providers to report clinical or quality data to governmental agencies; and patients’ time spent resolving medical bill disputes and completing paperwork. Australia and the United Kingdom are virtually tied for the best performance on these measures (Exhibit 7). Switzerland and the U.S. come in last.

Australia and the U.K. excel in administrative efficiency by minimizing payment and billing burdens. In Australia, electronic claims processing ensures instantaneous payments from public and private payers. In the U.K., because services are free to patients at the point of care, physicians do not bill patients or the government directly for each service. Instead, they are compensated directly by the National Health Service based on monthly data gleaned from patients’ electronic health records.

Switzerland and the U.S. performed poorly on most of our administrative efficiency measures. Many patients in the U.S. are forced to deal with medical bill issues, and, in both countries, patients are comparatively more likely to seek treatment in emergency departments for conditions that are treatable in outpatient settings, like a primary care physician’s office.15

In the uniquely complex U.S. system of public and private payers — featuring thousands of health plans, each with its own cost-sharing requirements and coverage limitations — physicians and other health care providers spend enormous amounts of time and effort billing insurers. Denials of services by insurance companies are also common, necessitating burdensome appeals by providers and patients.16 The fragmentation of health care delivery across Switzerland’s many cantons and municipalities may also be hindering efficiency for providers and patients alike.17

Blumenthal_mirror_mirror_2024_exhibit_08

Our Equity domain reflects how people with below-average and above-average incomes differ in their access to health care and their care experience. Australia and Germany rank highest for equity, meaning they are the countries with the smallest differences in health care access and care experiences between below-average and above-average income residents (Exhibit 8). New Zealand and the U.S. rank last on equity, having the highest income-related differences in reported cost-related access issues and instances of unfair treatment or feelings that health concerns were not taken seriously by health care professionals because of their racial or ethnic background.

What’s Changed in How We Measure Equity

We included several new measures of equity in this edition of Mirror, Mirror. One examined the percentage of patients reporting that they had been treated unfairly or not taken seriously when receiving health care. The other looked at self-reported health status as a proxy measure for health outcomes. Two additional new measures (not analyzed by income owing to sample-size limitations) drew from survey questions that asked physicians whether they thought health systems treat patients unfairly because of their racial or ethnic background, and if their patients had ever informed them that they were treated unfairly or not taken seriously when receiving health care because of their racial or ethnic background.

Blumenthal_mirror_mirror_2024_equity_expanded_exhibit

This edition also experimented with assessments of equity by gender (male/female) and geography (rural/nonrural). Because these perspectives on equity are new to Mirror, Mirror, we chose to provide two analyses of the equity domain: the first included income-related measures and physician perceptions of differences by race and ethnicity. The second analysis included the above measures and measures of geographical and gender-related equity, though only the first analysis was included in the calculation of overall performance rankings.

Because of changes in Sweden’s privacy laws, our recent international surveys could not ask income-related questions for Swedish respondents. Therefore, Sweden was dropped from the equity domain in this edition of Mirror, Mirror. Additionally, due to differences in how participating countries collect (or do not collect), define, and apply “race and ethnicity,” we are unable to report valid comparable data across countries on measures of equity by race and ethnicity. (For more information, see “How We Conducted This Study.”)

High performers on equity, including Australia, Germany, and the United Kingdom, have limits on cost sharing (or in the case of the U.K., no cost sharing at all) to ensure that the ability to pay does not constitute a significant barrier to obtaining needed health services. In Germany, out-of-pocket expenses are capped, with the cost of coverage being income-based. And because health coverage is mandatory, nearly everyone has access to a regular doctor.

Australia offers free care in all public hospitals, and the nation’s universal Medicare system provides all Australians with coverage for all or part of the cost of GP and specialist consultations and diagnostic tests, with additional subsidies available for private hospital care.18 The country’s Pharmaceutical Benefits Scheme, meanwhile, regulates and subsidizes medication costs to keep them affordable.19

When we expanded the definition of equity to encompass geography and gender, country rankings changed notably. Switzerland shifted to first, Canada moved up to fifth, and Germany and Australia fell to fourth and sixth, respectively. Australia and New Zealand’s poor performance for rural versus nonrural respondents contributed to their lower rankings.20 Switzerland moved to first place as a result of its minimal disparities between rural and nonrural areas and between males and females. Switzerland’s small size, along with the nation’s extensive transit options and, as of 2015, increased funding for women’s health, led to improved performance, including fewer childbirth injuries and a higher rate of postpartum checkups.21

Blumenthal_mirror_mirror_2024_exhibit_09

Health outcomes reported here refer to those outcomes that are most likely to be responsive to health care interventions. In this edition, we considered the impact of the pandemic by comparing performance on many measures before and after the start of the COVID-19 pandemic. We also examined specific COVID-related outcome measures. Outcome measures included: life expectancy at birth, excess deaths due to the pandemic, and deaths with preventable and treatable causes, which make up avoidable deaths. Across these measures, Australia, Switzerland, and New Zealand performed the highest among the 10 countries. The United States ranked last (Exhibit 9).

The top three countries’ high performance reflect in part their success in managing COVID-19. Australia implemented stringent border controls, lockdowns, quarantine requirements, and movement restrictions that helped prevent spread.22 New Zealand also reacted swiftly and strongly by closing borders and implementing public health interventions like national lockdowns and stay-at-home orders to prevent transmission, transitioning to a mitigation policy only after vaccinating 87 percent of the population.23 Switzerland, despite an early surge in cases, managed to keep excess mortality low by reopening businesses with effective public health measures like physical distancing, caps of the number of people in physical spaces, and contact tracing coordinated by the Federal Office of Public Health.24

The U.S. ranks last on four of five health outcome measures. Life expectancy is more than four years below the 10-country average, and the U.S. has the highest rates of preventable and treatable deaths for all ages as well as excess deaths related to the pandemic for people under age 75. The ongoing substance use crisis and the prevalence of gun violence in the U.S. contribute significantly to its poor outcomes, with more than 100,000 overdose deaths and 43,000 gun-related deaths in 2023 — numbers that are much higher than in other high-income countries.25 The U.K. also struggled with COVID-19 outcomes but saw a slight decrease in treatable mortality. The Netherlands, while performing well in other domains, did not stand out for health outcomes compared to other countries.

What the U.S. Can Do to Improve

The wide variation in performance across the 10 countries included in this edition of Mirror, Mirror suggests ample opportunities for cross-national learning. For example, nations wishing to improve their health system’s equity, administrative efficiency, and health outcomes could look to Australia for insights. Those looking to address problems of access could turn to the Netherlands. With regard to outcomes of care, Australia, Switzerland, and New Zealand are worthy of study. And to improve performance on care process, nations could examine New Zealand and the otherwise lagging U.S. health system for best practices.

The high U.S. performance on care process is particularly interesting. One possible explanation lies in the vigorous pay-for-performance, or value-based care, efforts that private and public payers in the United States have undertaken in recent years. While criticisms of these efforts are common in the U.S., the strategy may have succeeded in increasing systemwide conformance to guidelines for preventive services in particular. Despite comparatively high performance on care process, health outcomes in the U.S. are the worst of the 10 countries in this analysis, showing that care process may not be the primary driver of health outcomes. Additional research should examine the factors leading to the atypically strong U.S. performance in this domain.

Despite its record on care process, however, the U.S. continues to trail other countries in almost every other respect. Exhibit 4, which compares the 10 nations’ overall health care performance against their health care expenditures, dramatically displays the enduring U.S. dilemma of spending vast amounts for generally poor results — the very definition of a low-value health system.

The problems underlying this failure are well documented. Financial barriers to care in the U.S. remain substantial. Although successful implementation of the Affordable Care Act (ACA) has produced historically low uninsured rates, 26 million Americans — between 7 percent and 8 percent — still continue to lack coverage.26 All the comparator countries in our study have universal coverage.

The quality of coverage is also worse in the U.S. than in other countries. Among Americans with insurance, nearly a quarter are underinsured, facing high deductibles and copayments that reduce the effectiveness of their insurance in assuring access to needed care.27 None of the other countries in our analysis places its covered residents in such financial jeopardy.

The functioning of the U.S. health care delivery system also suffers from multiple deficits. First is the lack of investment in primary care. Years of neglect and undercompensation for primary care have resulted, predictably, in nationwide shortages of the clinicians who play a vital role in managing chronic illness and reducing the need for costly and sometimes unnecessary emergency, specialty, and hospital care services. The acquisition of primary care practices by health systems and private equity investors is further disrupting an already fragile primary care capacity, with uncertain short- and long-term consequences. The fragmented nature of the U.S. health care system makes it difficult even for many well-insured patients to access convenient and effective care.

A second area for improvement is administrative inefficiency. With thousands of health insurance products, wide variation in benefits, and complex utilization management policies, U.S. health care can be a nightmarish maze for patients and care providers alike. Adding further to the delivery system’s dysfunction have been recent trends in ownership and control. Massive consolidation through hospital mergers or hospital acquisitions of physician practices, among other examples, has enabled large providers to negotiate higher prices from private insurers — a key factor in the overall higher costs of care in the U.S.28 No other country relies to this extent on the unregulated private market to allocate vital health care resources.

Beyond the financing and delivery of services, social policies and influences outside health care strongly affect Americans’ health and put added stress on the health system. Gun violence and drug overdoses, for example, take a huge toll in morbidity and mortality, especially among young males. For centuries, racial discrimination has greatly harmed the economic prospects and health of people in the U.S., including Indigenous communities and Black Americans. Moreover, the general lack of an adequate social safety net to mitigate the threats of hunger, homelessness, and poverty also takes a huge toll on the health of Americans.

During COVID, the underfunding and decentralization of the national public health system, which vests most public health authorities in state and local governments, proved a huge obstacle to an effective national response.29

Reversing the dismal track record of the U.S. health system would require multiple, demanding interventions by government at all levels and by the private sector:

  • To improve equity in health care, the U.S. would have to continue to reduce financial barriers to access to care by extending coverage to the remaining uninsured. Reducing financial barriers would also require that insurance coverage itself meets some minimal standards of adequacy, including meaningful limits on patients’ out-of-pocket expenditures.
  • To reduce administrative burden, minimizing the variation and complexity of insurance plans will be critical, as will reducing the cost of care, which is driven primarily by high prices charged by providers. This would help simplify health plans and facilitate efforts to lower coinsurance and deductibles and make them more predictable and understandable.30
  • To make the delivery system more functional, at least two major reforms are necessary. The first is to build a robust primary care system through improved compensation of primary care clinicians and more investment in the training of primary care providers. There is hope that provision of care through telehealth and remote monitoring may improve access and cost, and artificial intelligence may be harnessed to make our complex billing and documentation systems less burdensome for providers. If so, it will be essential for the U.S. health system to put these technological advances to work as fast and seamlessly as is feasible.

A second delivery system reform would be to address the uncontrolled consolidation of health care resources in local markets, which helps drive prices higher and makes insurance less affordable for Americans.31 In this regard, the proliferation of investor-owned entities that buy and sell primary care practices like tradeable commodities deserves close scrutiny for its long-term impact on the cost and quality of care.32

  • To create a viable public health system capable of mitigating the burdens of chronic disease and organizing national defenses against likely future pandemics, the U.S. will need to expand investment in public health at all levels of government and increased federal authorities to respond to public health emergencies.33
Additional Resources

Although the U.S. health system has many unique features, there are lessons to be learned from countries that succeed in ensuring access to affordable, quality care. That’s why the Commonwealth Fund studies health systems around the world, seeks out policy and practice innovations, and compares health system performance among the U.S. and other nations. Find more information here.

  • To create a health system that truly safeguards the well-being of Americans, the U.S. will need interventions besides those directly related to health care services. These include efforts to reduce gun violence and deaths from substance use, to remedy the historical and ongoing effects of racism on the care and health of populations like Black, Hispanic, and Indigenous peoples, and to institute policies that protect against poverty, homelessness, and hunger.

Despite spending a lot on health care, the United States is not meeting one of the principal obligations of a nation: to protect the health and welfare of its residents. Most of the countries we compared are providing this protection, even though each can learn a good deal from its peers. The U.S., in failing this ultimate test of a successful nation, remains an outlier.

HOW WE CONDUCTED THIS STUDY

The 2024 edition of Mirror, Mirror was constructed using the methodological approach initially developed for the 2017 edition and subsequently used for the 2021 edition.34 In 2024, this approach was once again informed by an expert advisory panel convened to review measures, data, and methods for the report.35

Mirror, Mirror is unique in its heavy reliance on survey measures designed to capture the perspectives of patients and professionals — the people who experience health care in each country. Nearly three-quarters of the report’s measures are derived from patient or physician reports of health system performance.

Data

Survey data are drawn from Commonwealth Fund International Health Policy Surveys fielded during 2021, 2022, and 2023. Since 1998, in close collaboration with international partners, the Commonwealth Fund has supported these surveys of the public’s and primary care physicians’ experiences of their health care systems. Each year, in collaboration with researchers and partners in the 10 countries, a common questionnaire is developed, translated, adapted, and pretested. In 2021 we surveyed adults age 65 and older. The 2022 survey was of primary care physicians and the 2023 survey was of the general population (adults age 18 and older). The 2021 and 2023 surveys examined patients’ views of the health care system, quality of care, care coordination, patient–physician communication, wait times, and access problems. The 2022 survey examined primary care physicians’ experiences providing care to patients, use of information technology, and use of teams to provide care.

The Commonwealth Fund International Health Policy Surveys (2021, 2022, and 2023) include nationally representative samples drawn at random from the populations surveyed. The 2021 and 2023 surveys’ sampling frames were generated using probability-based overlapping landline and mobile phone sampling designs and, in some countries, listed or nationwide population registries. The 2022 survey of primary care physicians was drawn from government or private company lists of practicing primary care doctors in each country, except in France, where the sample was from a nationally representative panel of primary care physicians. Within each country, experts defined the physician specialties responsible for primary care, recognizing that roles, training, and scopes of practice vary across countries. In all countries, general practitioners (GPs) and family physicians were included, with internists and pediatricians also sampled in Switzerland and the United States. Appendix 9 presents the number of respondents and response rates for each survey. Further details of the survey methods are described elsewhere.36

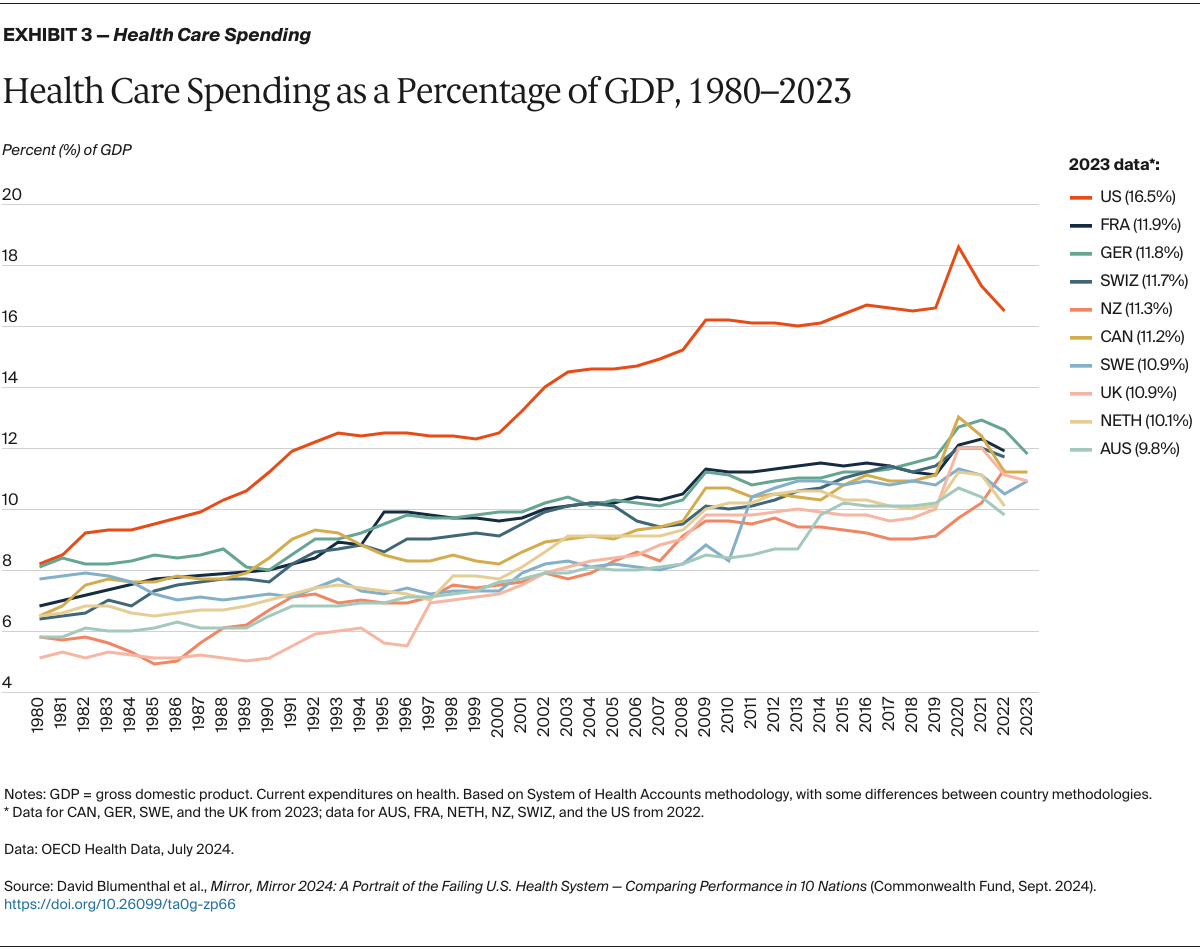
In addition to the survey items, standardized data were drawn from recent reports of the Organisation for Economic Co-operation and Development (OECD), Our World in Data, the World Health Organization (WHO), publicly and not publicly available country-specific mortality data, the peer-reviewed literature, and from the U.S. Agency for Healthcare Research and Quality.

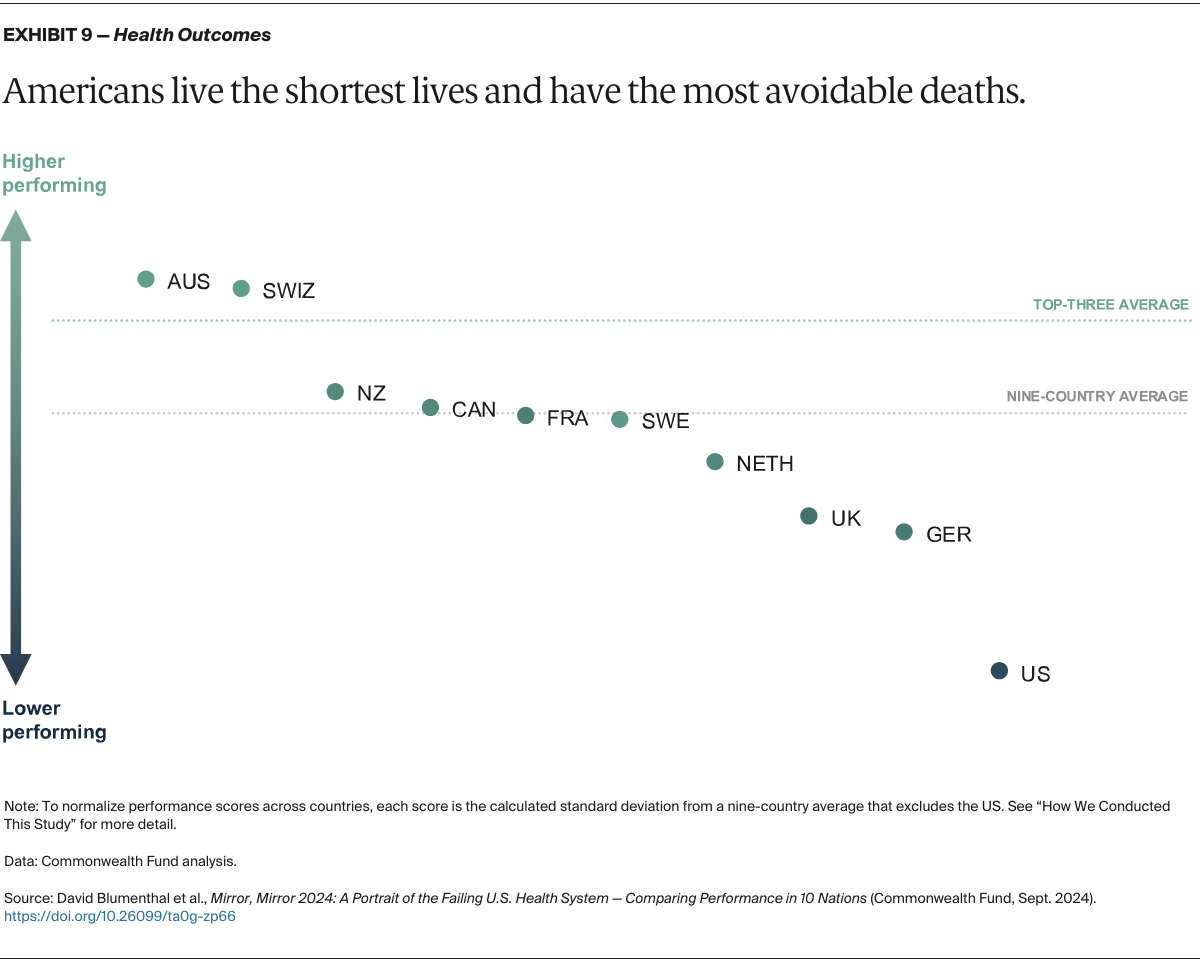
In the health outcomes domain of the 2024 report, treatable and preventable mortality data were calculated by pulling ICD-10 coded mortality data according to the OECD’s definitions of preventable and treatable mortality across all 10 countries. The respective national registries providing data for each country were: the Australian Bureau of Statistics (ABS, Australia); Statistics Canada (Canada); Le Centre d'épidémiologie sur les causes médicales de décès (CépiDc, France); Destatis (Federal Statistical Office Germany, Germany); Centraal Bureau voor de Statistiek (Statistics Netherlands, the Netherlands); Health New Zealand (New Zealand); Socialsytrelsen (Sweden); Federal Office of Public Health (FOPH, Switzerland) and the Center for Disease Control and Prevention’s WONDER online database (CDC Wonder, U.S.). For the United Kingdom, we combined data from the Northern Ireland Statistics and Research Agency (NISRA, Northern Ireland), the National Records of Scotland (NRS, Scotland), and the Office for National Statistics (ONS, England & Wales). Note that 2021 mortality data from New Zealand are preliminary as there are significant delays in finalizing the results on official cause of death, and, as a result, present underestimates of preventable and treatable mortality.

Changes Since 2021

The majority of measures included in this report are the same as in the 2021 edition of Mirror, Mirror (see Appendix 2). Four 2021 measures were dropped if a survey question was no longer included in the Commonwealth Fund International Health Policy Survey. Nine measures were considered “modified” in the 2024 report because the wording of a survey item was altered, or the measures were combined due to high correlation.

In 2022, Norway exited the International Health Policy Survey. In the more recent suite of surveys, new privacy laws in Sweden prohibited collection of income data which prevented inclusion of Sweden in our income-related equity analyses.

We worked to include new measures to fill previously identified gaps in performance measurement across the 10 countries and to capture newly relevant topics such as telehealth, discrimination experienced by patients, physician burnout, and the effects of the COVID-19 pandemic. Measures related to wait times that were excluded from the 2021 report because they were fielded in the early days of the COVID-19 pandemic were added back to this edition. In selecting new measures, we took into account the availability and timeliness of the data, and how they correlated with other measures in each domain. In the end we included 17 new measures across the five domains (see “How We Measured Performance” for details).

Analysis

The method for calculating performance scores and rankings is similar to that used in the 2021 and 2017 reports, except that we modified the calculation of relative performance because the U.S. was a distinct and substantial outlier (see below).

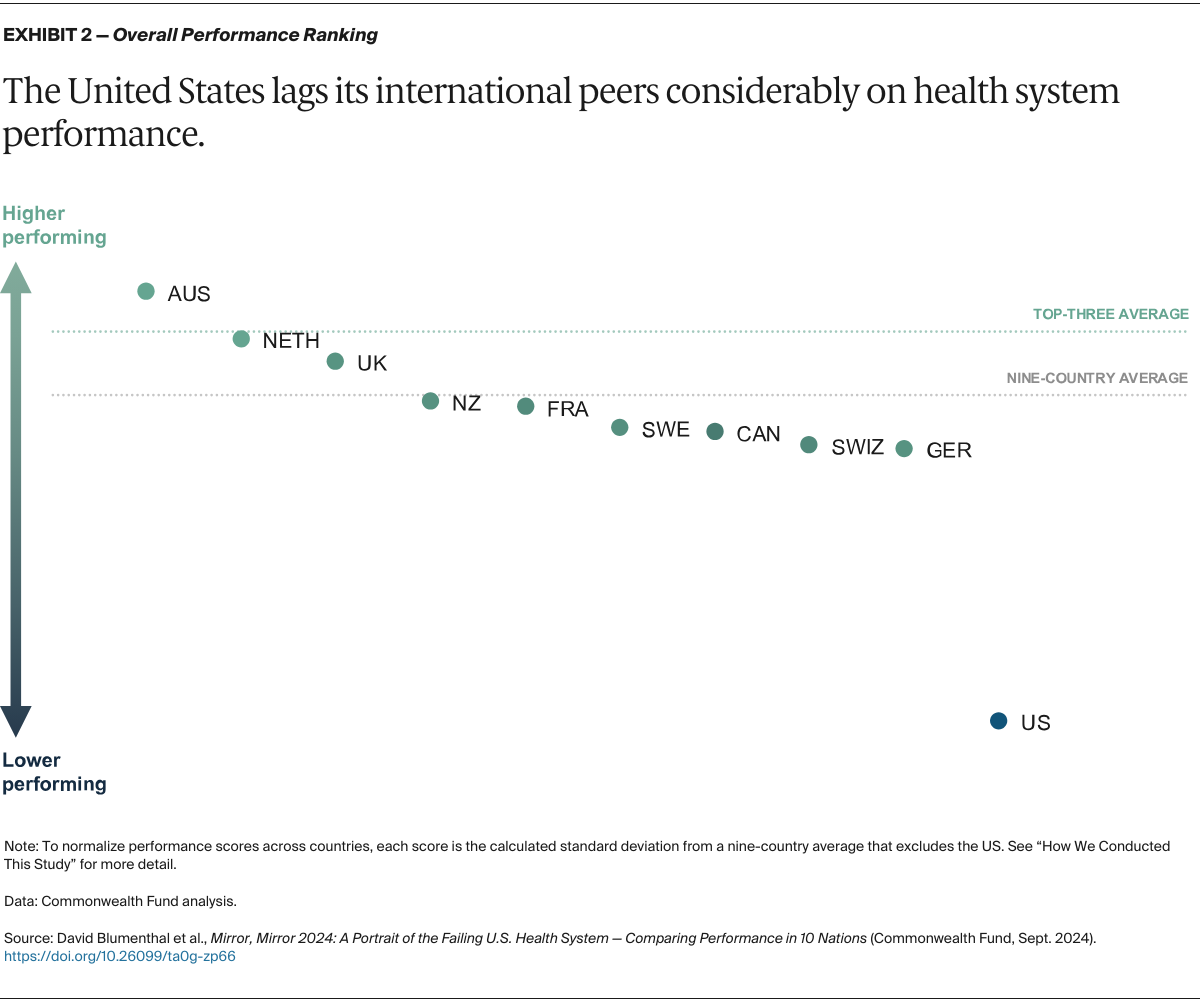
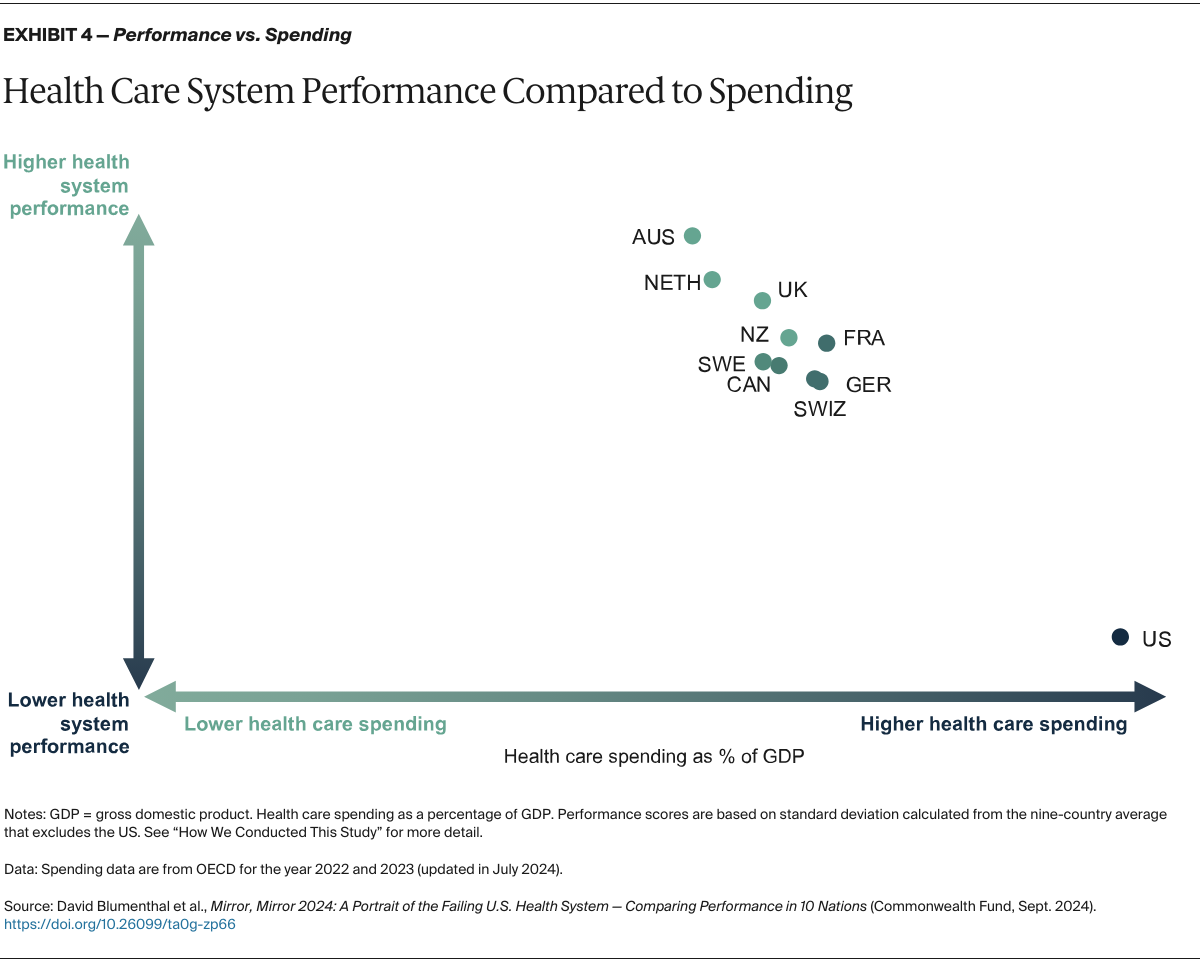
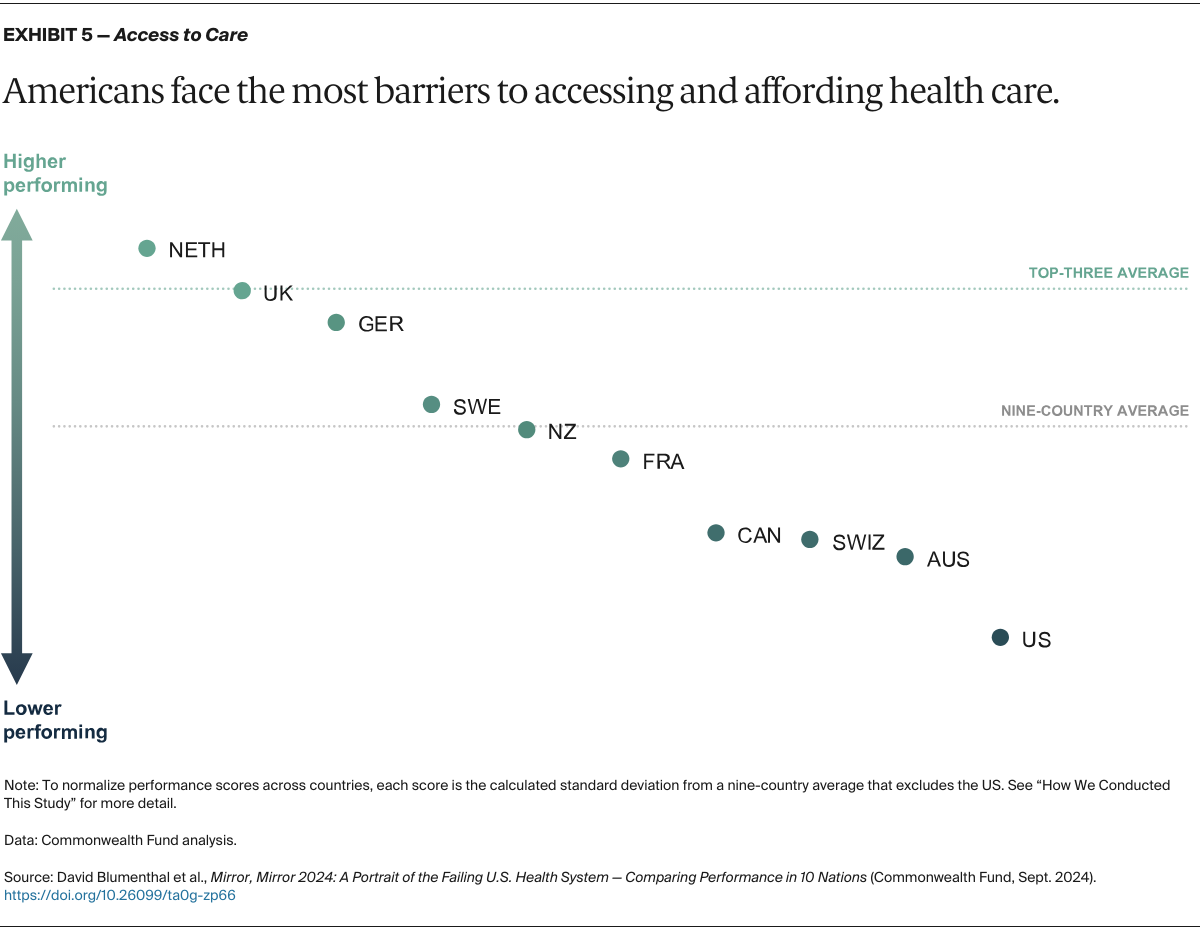
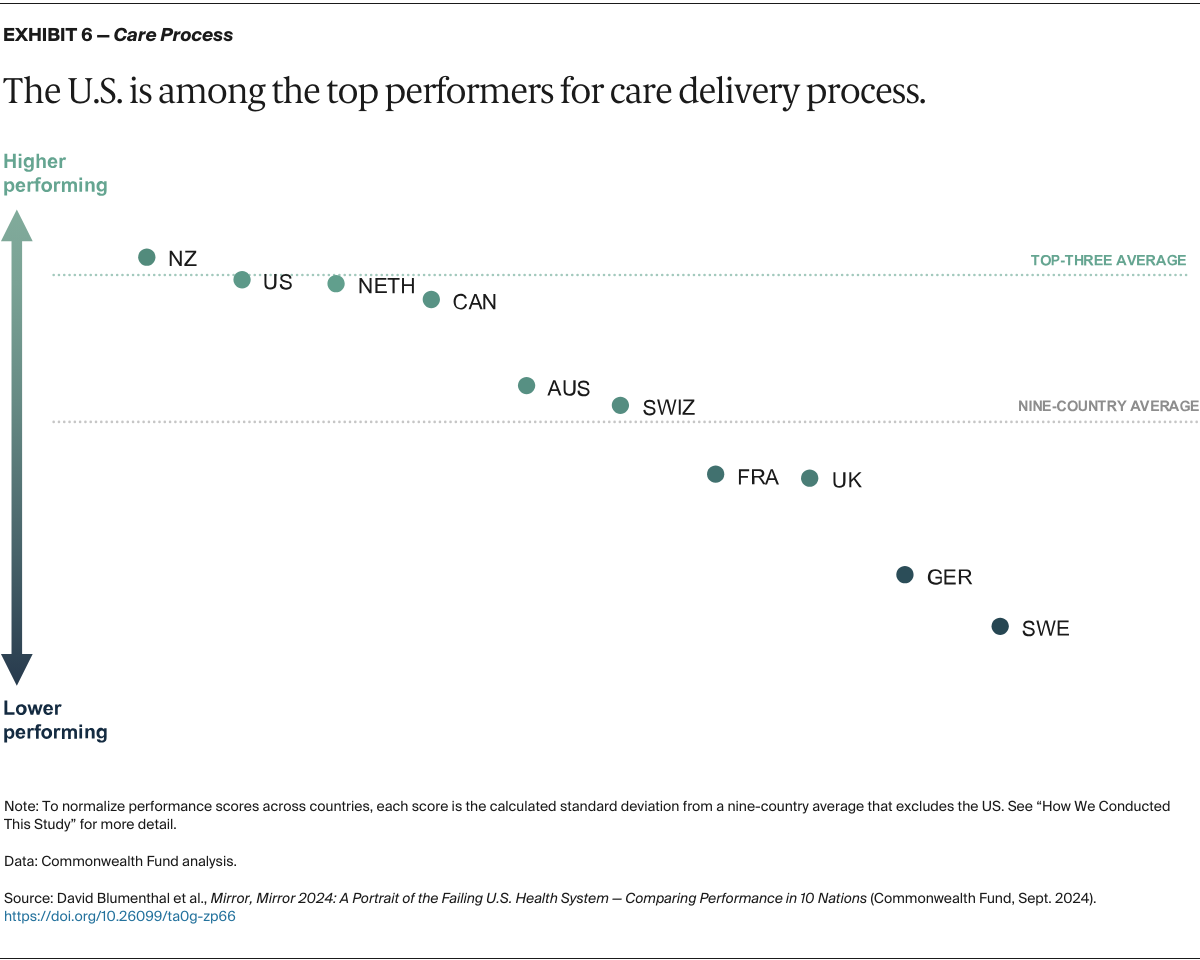
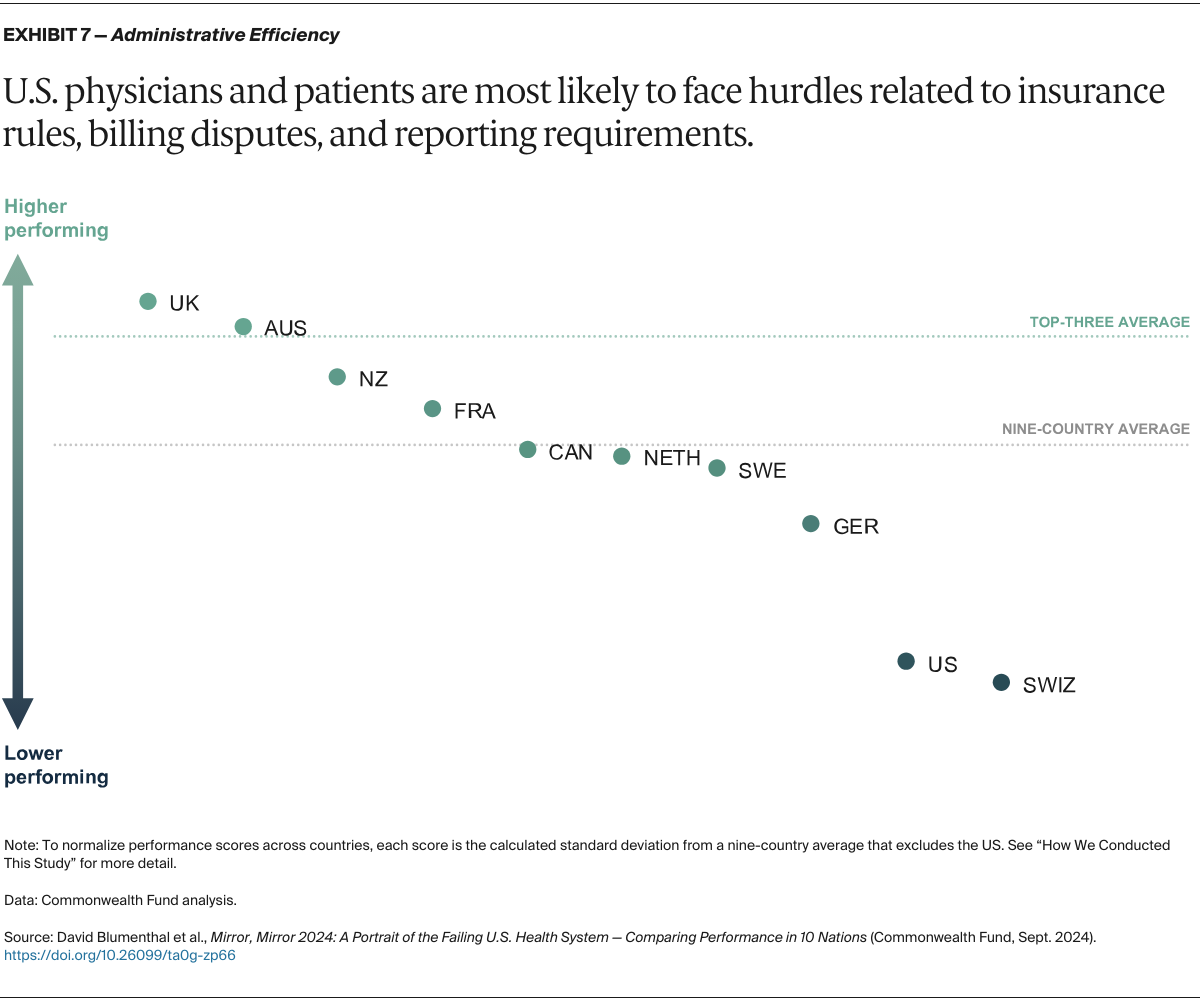
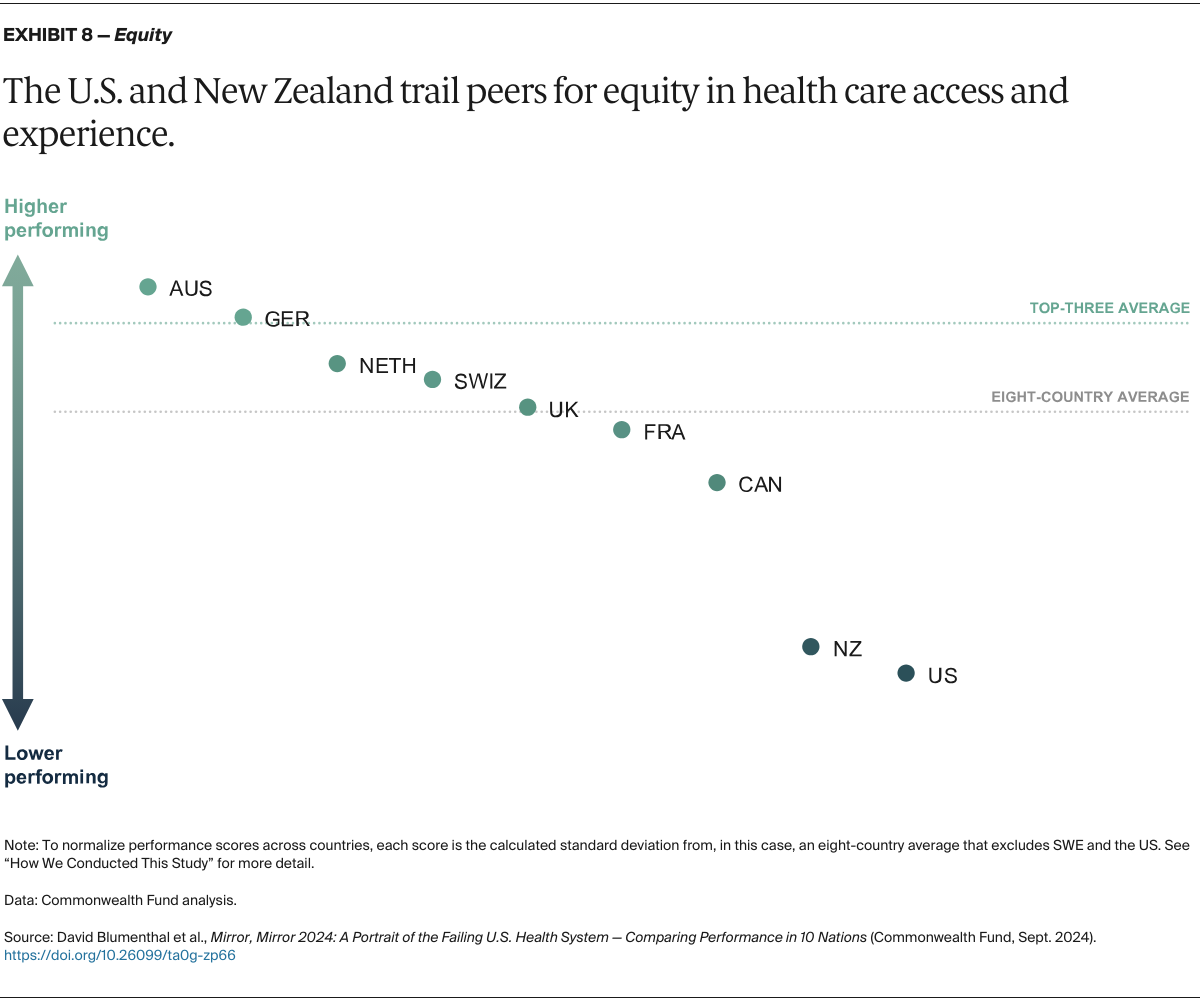
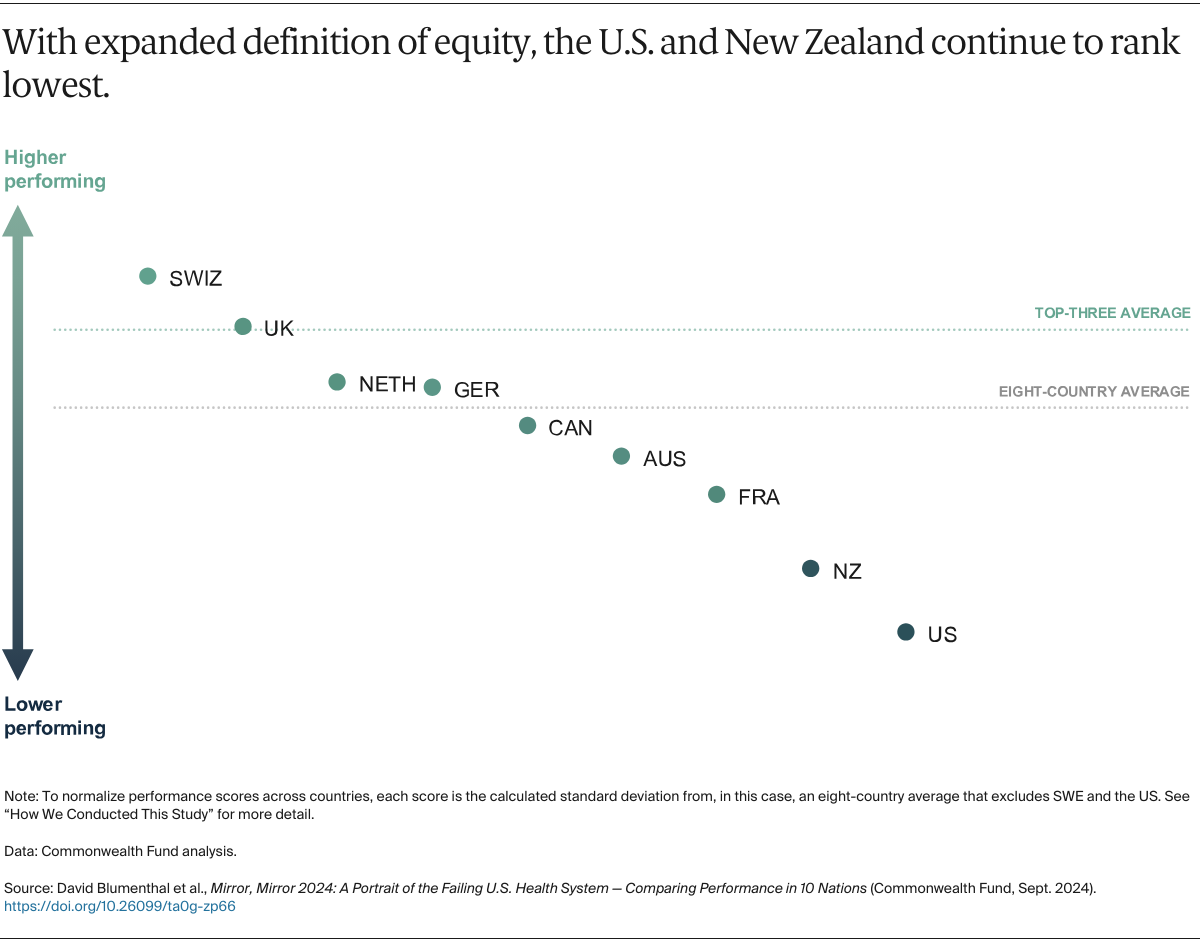
Normalized indicators: For each measure, we converted each country’s result (e.g., the percentage of survey respondents giving a certain response or a mortality rate) to a measure-specific, normalized performance score, which we refer to as normalized indicators. These indicators were calculated as the difference between the country result and the nine-country mean (excluding the U.S.), divided by the standard deviation of the results for each measure (see Appendices 4 through 8). Normalizing the results based on the standard deviation accounts for differences between measures in the range of variation among country-specific results. A positive normalized indicator indicates the country performs above the group average; a negative indicator indicates the country performs below the group average. Performance scores in the equity domain were based on the difference between higher-income and lower-income groups, and in the expanded equity domain were based on the difference between rural and nonrural groups and females and males, with a wider difference interpreted as a measure of lower equity between the groups in each country.

The normalized scoring approach assumes that results are normally distributed. In 2024, as in 2021, we noted that the U.S. was such a substantial outlier that it was negatively skewing the mean performance, violating the assumption. In past Mirror, Mirror reports, we included all 11 countries in calculating the mean and standard deviation of each measure. In the 2024 and 2021 editions, however, we conducted an outlier analysis (see below), which strongly suggested that it would be more accurate to exclude the U.S. from determining the mean performance and standard deviations of each measure. This modification changes a country’s performance scores relative to the mean but does not affect the ranking of countries relative to one another.

Correlations: In this edition, we conducted a Spearman rank correlation analysis on all the measures included in the final measure list. A correlation coefficient above 0.4 was used to determine whether or not to combine measures. For any measures found to be correlated above 0.4, within the same domain or subdomain, and where there were thematic similarities between the measures, they were combined. There was one instance of correlated measures being combined in the Access to Care domain, three in the Care Process domain, one in the Administrative Efficiency domain, and one in the Equity domain.

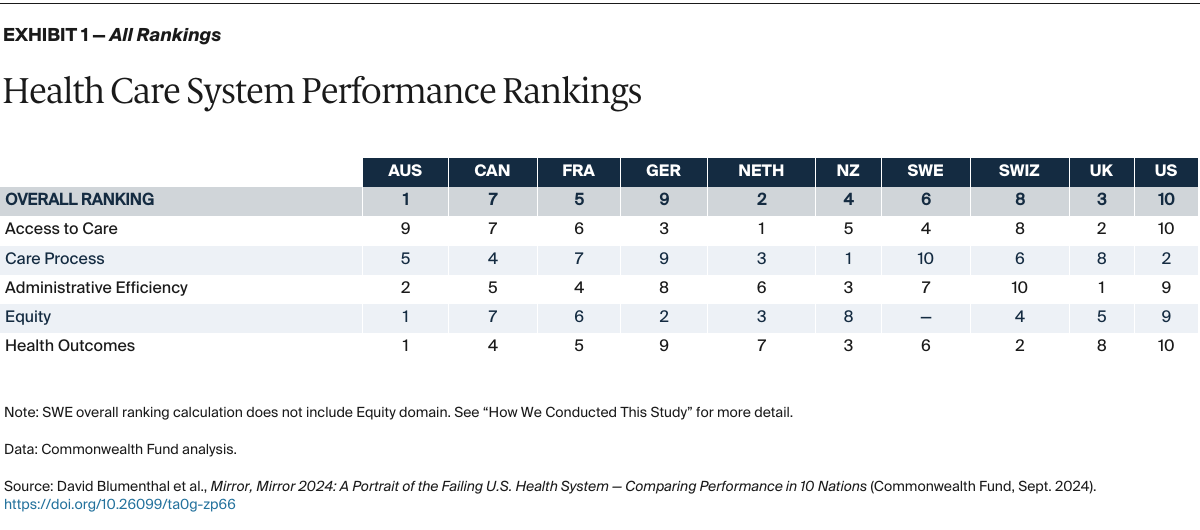
Domain performance scores and ranking: For each country, we calculated the mean of the normalized indicators in each domain. Then we ranked each country from 1 to 10 based on the mean domain performance score, with 1 representing the highest performance score and 10 representing the lowest performance score, with the exception of the “Equity” domain, where the scale was from 1 to 9 due to the removal of Sweden.

Overall performance scores and ranking: For each country, we calculated the mean of the five domain-specific performance scores. Then, we ranked each country from 1 to 10 based on this summary mean score, again with 1 representing the highest overall performance score and 10 representing the lowest overall performance score. Again, the “Equity” domain was ranked on a scale of 1 to 9 due to the removal of Sweden.

Outlier analysis: We applied Tukey’s boxplot method of detecting statistical outliers and identified that the U.S. was an outlier on overall performance. The U.S. was also a statistical outlier in the equity and health outcomes domains. The test identified isolated instances of other countries as statistical outliers on specific measures, but the pattern for other countries was inconsistent and the outlier differences were smaller than for the U.S.

Sensitivity analysis: We checked the sensitivity of the results to different methods of excluding the U.S. as an outlier. First, we excluded the U.S. from the calculation of the other countries’ domain and subdomain scores. We also removed the U.S. from the performance score calculation of each domain in which it was a statistical outlier on at least one indicator (otherwise keeping the U.S. in calculation of other domains where it was not an outlier; see Appendix 3). We also excluded the U.S. and other countries from the domains in which they were outliers, but the overall performance scores generated under this approach were similar to excluding the U.S. from every performance score calculation. Based on these results, we excluded the U.S. from the calculation of each country’s overall performance score. The U.S. was included in the calculation of its own overall performance score.

We tested the stability of the ranking method by running two tests based on Monte Carlo simulation to observe how changes in the measure set or changes in the results on some measures would affect the overall rankings. For the first test, we removed three measure results from the analysis at random and then calculated the overall rankings on the remaining 67 measure results, repeating this procedure for 1,000 combinations selected at random. For the second test, we reassigned at random the survey measure results derived from the Commonwealth Fund International Health Policy Surveys across a range of plus or minus 3 percentage points — approximately the 95 percent confidence interval for most measures — recalculating the overall rankings based on the adjusted data and repeating this procedure 1,000 times.

The sensitivity tests showed that the overall performance scores for each country varied but that the ranks clustered within several groups similar to those shown in Exhibit 1. Among the simulations, Australia, the Netherlands, and the United Kingdom were nearly always ranked among the three top countries; the U.S. was always ranked at the bottom, while Switzerland was also nearly always ranked toward the bottom. The other five countries varied in order between the fourth and eighth ranks. These results suggest that the selected ranking method was not highly sensitive to the choice of indicators.

Limitations

This report has limitations. Some are particular to our analysis, while some are inherent in any effort to assess overall health system performance. No international comparative report can encapsulate every aspect of a complex health care system. As described above, our sensitivity analyses suggests that comparative country rankings in the middle of the distribution (but not the extremes) are somewhat sensitive to small changes in the data or indicators included in the analysis, but these changes do not move these countries out of the middle group of the distribution.

Second, despite improvements in recent years, standardized cross-national data on health system performance are limited. The Commonwealth Fund surveys offer unique and detailed data on the experiences of patients and primary care physicians but do not capture important dimensions that might be obtained from medical records or administrative data. Furthermore, patients’ and physicians’ assessments might be affected by their expectations, which could differ by country and culture. Augmenting the survey data with standardized data from other international sources adds to our ability to evaluate population health and disease-specific outcomes, particularly regarding the impact of the COVID-19 pandemic. Some topics, such as hospital care and mental health care, are not well covered by currently available international data. Furthermore, it is very difficult to characterize performance of such institutions through surveys because no single individual has a full perspective on that performance, and surveying multiple respondents from representative samples of institutions is logistically challenging and extremely costly.

Third, we base our assessment of overall health system performance on five domains — access to care, care process, administrative efficiency, equity, and health outcomes — which we weight equally in order to calculate each country’s overall performance score. We recognize that there is a limitation around care process in that we do not measure quality for acute care conditions, especially in hospitals. Work related to this is underway but would always suffer from limits of generalizability because of limits of studying every conceivable diagnosis.

We also recognize that other elements of system performance, such as innovative potential or public health preparedness, are important. We continue to seek feasible standardized indicators to measure other domains. COVID results, included for the first time in this report, capture some aspects of public health preparedness and system resilience, but are also limited in many respects.

Fourth, in defining the five domains, we recognize that some measures could plausibly fit within several domains. The assignment of measures to domains was reviewed extensively internally and externally with an expert advisory panel. To inform action, country performance should be examined at the level of individual measures in addition to the domains we have constructed.

HOW WE MEASURED PERFORMANCE

Access to Care. The access to care domain encompasses two subdomains: affordability and, in this edition, availability (known as timeliness in the previous edition). The four measures of affordability include patient reports of avoiding medical care or dental care because of cost, having high out-of-pocket expenses, facing insurance shortfalls, or having problems paying medical bills. Because of changes in Sweden’s privacy laws, data were not available for Sweden for three measures in the affordability subdomain.

The availability subdomain includes nine measures summarizing how quickly patients can obtain information, make appointments, and obtain urgent care after hours. The 2024 report includes two new measures on the percentage of respondents who waited less than one week for an appointment with a specialist and waited less than one month for nonemergency surgery after being advised the respondent needed surgery. One measure of use of digital health was moved from the care process domain to the availability subdomain.

Care Process. The care process domain encompasses four subdomains relevant to the delivery of health care for the general population: preventive care, engagement and patient preferences, safe care, and coordinated care.

The preventive care subdomain includes four survey items related to counseling by health professionals on healthy behaviors, including one new measure on the use of telehealth to assess mental and behavioral health needs, three OECD measures of mammography screening and influenza and measles vaccination, three OECD measures of rates (age- and sex-standardized) of avoidable hospital admissions for three prevalent chronic conditions (diabetes, asthma, and congestive heart failure), and one new measure for completion of the initial COVID-19 vaccination protocol from Our World in Data. The wording of one survey question was modified to include all qualified respondents, not a subsection of the survey respondents as in the previous edition of this report.

The engagement and patient preferences subdomain consists of 15 measures that evaluate the delivery of patient-centered care, which includes effective and respectful clinician–patient communication and care planning that reflects the patient’s goals and preferences.

There were a number of new measures in the engagement and patient preferences subdomain in the 2024 report:

  • two that examined the percentage of patients who received health care by a primary care provider via telehealth and by a mental health professional via telehealth in the past 12 months
  • the percentage of patients who had been treated unfairly or whose health concerns were not taken seriously when receiving health care
  • two related to physician burnout, looking at percentage of physicians reporting feeling burned out and the percentage who reported the quality of their medical care had worsened since the onset of the COVID-19 pandemic.

Language for one measure changed regarding patients reporting their regular doctor or medical provider treated them with courtesy and respect. Two measures of chronically ill patients discussing their health goals and priorities or their treatment options with a health professional and two measures of older adults having a written end of life care plan or a written plan naming someone to make treatment decisions for them if they cannot do so were combined due to high correlation. One 2021 measure was excluded from the 2024 edition of Mirror, Mirror because it was not asked in the latest round of international surveys.

The safe care subdomain includes two survey items: one indicator of safe care based on patient reports of failure to receive effective prescription medication management, as well as one measure whose wording changed since 2021 to indicate whether a primary care physician’s practice offers patients the option to view test results online. The subdomain also includes two OECD measures related to adverse events occurring after hospital procedures. U.S. data for postoperative pulmonary embolism in hip and knee replacement discharges was calculated by the Agency for Healthcare Research and Quality’s Healthcare Cost and Utilization Project.

The coordinated care subdomain uses six measures to summarize timely sharing of information among primary care clinicians, specialists, emergency departments, and hospitals. It includes four physician-reported measures of effective communication among primary care clinicians and home care, social service providers, and emergency departments. Two measures were combined because they were highly correlated. One new measure looks at the percentage of patients who reported their regular doctor’s practice always or often helps coordinate or arrange the care patients receive from other doctors and places. One 2021 measure was excluded because it was not asked in the latest round of international surveys.

Administrative Efficiency. The administrative efficiency domain includes four measures. Three assess patients’ and primary care clinicians’ reports of time and effort spent dealing with paperwork or administrative issues, as well as disputes related to documentation requirements of insurance plans and government agencies. One patient-reported measure evaluates barriers to care because of limited availability of the regular doctor. Two measures were combined because of their high correlation.

Equity. The equity domain compares performance for higher- and lower-income individuals within each country, using eight selected survey measures from the care process and access to care domains and one measure unique to the equity domain. The analysis stratifies the surveyed populations based on reported income (above or below the country’s average income) and calculates a percentage-point difference in performance between the two groups. A larger percentage-point difference represents lower equity between income groups in that country. A negative percentage-point difference indicates better performance among those with below-average income. One new 2024 measure, which also appears in the Engagement and Patient Preferences subdomain, is related to patient experiences of unfair treatment when receiving health care. An additional new 2024 measure is related to health outcomes, looking at the difference between those with low- and high-income as it relates to self-reported health status. Two 2021 measures related to cost-related access problems with medical and dental care were combined because they were highly correlated in our 2024 results. (see “Access to Care,” above). Three measures from 2021 were excluded.

Two additional measures of discrimination, reported by primary care physicians, were included in the equity domain in the 2024 report. These two measures were not stratified by reported income, as primary care physicians are not asked about patient income in the international surveys.

To compare experiences among adults with below-average incomes and those with above-average incomes, the 2023 survey asked respondents whether their income was below, at, or above the national average. The survey told respondents, “The average household income of families in this country is around ____.” The values were drawn from national statistical offices and confirmed by country experts. They did not take into account household composition or regional variation, and it is possible that the incomes provided were not defined in the same way or understood in the same way across countries.

Respondents were then instructed to think about their pretax income, and asked, “By comparison, is your household income much above, somewhat above, average, somewhat below, or much below average?” Respondents indicating their income was “somewhat below” or “much below” average were categorized as “lower or average income,” whereas those reporting incomes “much above” or “somewhat above” average were categorized as “higher income.”37

In addition to comparing performance on select measures by income, in the 2024 edition of this report we also compare countries on the same measures by stratifying the surveyed populations based on location (rural versus nonrural) and gender (female versus male), though these additional measurements were not used in the calculation of overall country performance scores, as we were not comfortable weighting rurality and gender at the same level as income. We used country-specific definitions of rurality based on a previous peer-reviewed analysis of the 2020 Commonwealth Fund International Health Policy Survey and recommendations and analysis by survey firm SSRS.38 Of note is that we did not stratify by respondent race and ethnicity because a number of participating countries do not collect such data as a matter of national policy. We did not stratify by reported LGBTQ+ identity because sample sizes were too small.

Health Outcomes. In this edition, we modified the health outcomes section to include measures that may be primarily influenced by social and economic factors, such as life expectancy at birth, as well as outcomes that are more closely related to provision of health care services. The 2021 edition of Mirror, Mirror included only the latter type of indicator. The 2024 measures fall into two categories: population health measures and mortality amenable to health care.

As a population health outcome, we included life expectancy at birth, measuring the distance from the 10-country OECD average. We also include World Health Organization measures of excess deaths that are associated with the COVID-19 pandemic for those younger than 75 years of age and those older than 75 years to quantify the impact of the pandemic on mortality.

Mortality amenable to health care captures deaths at all ages from specific causes that are considered preventable and treatable through timely and effective health care. According to the OECD, deaths considered preventable are those that can be avoided through effective primary prevention and other public health measures (“preventable mortality”). Treatable deaths are considered preventable through more effective and timely health care interventions (“treatable mortality”).39 To avoid double-counting COVID-19 deaths in multiple measures, COVID-19 deaths were removed from the calculation of preventable mortality and subsequently the difference in avoidable mortality between 2022 (or latest year) and 2019. All country data were for 2022 except France and New Zealand, where the latest data are from 2021.

A number of the measures reported separately in 2021, such as maternal mortality, suicide deaths, infant mortality, and stroke mortality are now captured in the category of preventable and treatable mortality.

ACKNOWLEDGMENTS

The authors would like to thank the members of the 2024 advisory panel — Melinda Buntin, Richard Frank, Michael Kidd, Niek Klazinga, Irene Papanicolas, Tom Rice, and Nana Twum-Danso — for their input in meetings and reviews of drafts of Mirror, Mirror. We thank our Commonwealth Fund colleagues: Chris Hollander, Aishu Balaji, Bethanne Fox, Josh Tallman, Paul Frame, Jen Wilson, Sam Chase, Maya Brod, and Gabby O’Brien (production and dissemination); Joseph Betancourt, Tony Shih, Sara Collins, and Rachel Nuzum (report reviewers); Dave Radley for his help on data analysis in the early development stages of this edition of Mirror, Mirror; and Celli Horstman, Carson Richards, Avni Gupta, and Kristen Kolb (data checkers). Finally, we thank Rie Fujisawa from OECD, Pam Owens and her team at AHRQ, Louisa Logovik from the Australian Bureau of Statistics, Cécilia Rivera and Elise Coudin from CépiDc – Inserm, and Fiona Wild from Health New Zealand for their insights and assistance in producing this report.

NOTES
  1. See the “International Surveys” page on the Commonwealth Fund website. The nine countries included in this report are those that have had longstanding relationships with the Commonwealth Fund and with which we have been able to pursue cross-country survey work. A number of the countries are also partners with the Commonwealth Fund on the Harkness Fellowship. The nine countries all have unique, high-functioning health systems which provide lessons for U.S. policymakers and health system leaders to learn from. With that, we know there are countries beyond the nine included in this report that can teach us valuable lessons — we continually track initiatives and policies that countries around the world are implementing, and we hope to include more countries in future work.
  2. Congressional Budget Office, The Long-Term Outlook for Health Care Spending (CBO, n.d.).
  3. CZ, “Health Insurance Deductible: How It Works,” n.d. Patients in the Netherlands have flexibility in how much of their annual deductible to pay. Those wanting lower insurance rates opt to pay a larger portion of the deductible.
  4. Roosa Tikkanen et al. (eds.), “England,” in International Health Care System Profiles (Commonwealth Fund, 2020); Siva Anandaciva, How Does the NHS Compare to the Health Care Systems of Other Countries? (The King’s Fund, June 2023); “£38bn Extra per Year Needed to Revive the NHS,” The Health Foundation, June 20, 2024; Max Warner and Ben Zaranko, The Past and Future of NHS Waiting Lists in England (Nuffield Foundation, Feb. 2024); Joshua Gabert-Doyon and Akila Quinio, “‘I Don’t Have a Choice’: UK Patients Turn to Medical Loans for Treatment Costs,” Financial Times, May 3, 2024; and Estera Mendelsohn et al., Feeling the Pressure: What the 2023 Commonwealth Fund Survey Reveals About the State of the U.K. Health System (The Health Foundation, Aug. 2024). Some reviewers familiar with the United Kingdom’s health system expressed surprise at its relatively high ranking given highly publicized recent reports of problems with the National Health Service, including long waiting times for elective care and provider burnout. The U.K.’s overall performance reflects its strong record on two key domains: access to care and administrative efficiency. These result in turn from the U.K.’s unique commitment to service “free at the point of care,” which eliminates all cost barriers to services and the administrative burdens created by the need to bill for and pay for care. In other domains, the U.K. is generally in the middle of the distribution (with the exception of outcomes). If, like many other comparator countries, the U.K. were to abandon its commitment to free services, its ranking would likely decline.
  5. Co-Payments and Exemption from Co-Payments,” Health Insurance Germany, n.d.
  6. Roosa Tikkanen et al. (eds.), “Netherlands,” in International Health Care System Profiles (Commonwealth Fund, 2020).
  7. Roosa Tikkanen et al. (eds.), “Germany,” in International Health Care System Profiles (Commonwealth Fund, 2020).
  8. Rezwanul Hasan Rana, Khorshed Alam, and Jeff Gow, “Selection of Private or Public Hospital Care: Examining the Care-Seeking Behavior of Patients with Private Health Insurance,” BMC Health Services Research 20 (May 6, 2020): 380; and Australian Government Department of Health and Aged Care, “Private Health Insurance Reforms,” July 2024.
  9. Australian Government Department of Health and Aged Care, “Private Health Insurance Reforms,” July 2024.
  10. Jessica Hale et al., “Health Insurance Coverage Projections for the U.S. Population and Sources of Coverage, By Age, 2023–34,” Health Affairs 43, no. 7 (July 2024): 922–32.
  11. Corinne Lewis et al., Evidence from a Decade of Innovation: The Impact of the Payment and Delivery System Reforms of the Affordable Care Act (Commonwealth Fund, Apr. 2022).
  12. Noel Eldridge et al., “Trends in Adverse Event Rates in Hospitalized Patients, 2010–2019.” JAMA 328, no. 2 (July 12, 2022): 173–83.
  13. Roosa Tikkanen et al. (eds.), “New Zealand,” in International Health Care System Profiles (Commonwealth Fund, 2020).
  14. Roosa Tikkanen et al. (eds.), “Netherlands,” in International Health Care System Profiles (Commonwealth Fund, 2020).
  15. Ani Turner, George Miller, and Elise Lowry, High U.S. Health Care Spending: Where Is It All Going? (Commonwealth Fund, Oct. 2023).
  16. Avni Gupta et al., Unforeseen Health Care Bills and Coverage Denials by Health Insurers in the U.S. (Commonwealth Fund, Aug. 2024).
  17. Severine Schussele Filliettaz et al., “Integrated Care in Switzerland: Strengths and Weaknesses of a Federal System,” International Journal of Integrated Care 21, no. 4 (Oct.–Dec. 2021): 10.
  18. Emily J. Callander, “Out-of-Pocket Fees for Health Care in Australia: Implications for Equity,” Medical Journal of Australia 218, no. 7 (Apr. 2023): 294–97.
  19. Pharmaceutical Benefits Scheme, “About the PBS,” Australian Government Department of Health and Aged Care, last updated May 7, 2024.
  20. Australian Institute of Health and Welfare, “Rural and Remote Health,” last updated Apr. 2024; and New Zealand Government, Rural Health Strategy 2023 (NZ Government, July 2023).
  21. Pauline Turuban, “Why the Rural–Urban Rift Is Less Deep in Switzerland Than Elsewhere,” SwissInfo.ch, July 17, 2021; and United Nations Population Fund, “Switzerland,” n.d.
  22. Philip Clarke and Andrew Leigh, “Understanding the Impact of Lockdowns on Short-Term Excess Mortality in Australia,BMJ Global Health 7, no. 11 (Nov. 10, 2022): e009032.
  23. Q. Sue Huang et al., “Impact of the COVID-19 Related Border Restrictions on Influenza and Other Common Respiratory Viral Infections in New Zealand,” Influenza and Other Respiratory Viruses 18, no. 2 (Feb. 2024): e13247; and Jennifer Summers et al., “Improvements and Persisting Challenges in COVID-19 Response Compared with 1918–19 Influenza Pandemic Response, New Zealand (Aotearoa),” Emerging Infectious Diseases 29, no. 9 (Sept. 2023): 1827–36.
  24. Fritz Sager and Céline Mavrot, “Switzerland’s COVID-19 Policy Response: Consociational Crisis Management and Neo-Corporatist Reopening,” European Policy Analysis 6 no. 2 (Dec. 2020): 293–304.
  25. Center for Gun Violence Solutions, “Firearm Violence in the United States,” Johns Hopkins Bloomberg School of Public Health, n.d.; Kaitlin Washburn, “Nearly 43,000 People Died from Gun Violence in 2023: How to Tell the Story,” Association of Health Care Journalists Blog, Feb. 14, 2024; National Institute on Drug Abuse, “Drug Overdose Death Rates,” last updated May 14, 2024; and Evan D. Gumas and Jesse C. Baumgartner, “U.S. Overdose Deaths Remain Higher Than in Other Countries — How Harm-Reduction Programs Could Help,” To the Point (blog), Commonwealth Fund, June 22, 2023.
  26. Jennifer Tolbert, Patrick Drake, and Anthony Damico, Key Facts About the Uninsured Population (KFF, Dec. 2023).
  27. Sara R. Collins, Lauren A. Haynes, and Relebohile Masitha, The State of U.S. Health Insurance in 2022: Findings from the Commonwealth Fund Biennial Health Insurance Survey (Commonwealth Fund, Sept. 2022).
  28. Tara Oakman, Thomas Waldrop and Lex Brierley, How States Can Advance Equity When Addressing Health Care Consolidation (Century Foundation, Mar. 2024); and Cheryl L. Damberg, Health Care Consolidation: The Changing Landscape of the U.S. Health Care System, Invited Testimony: U.S. House of Representatives Committee on Ways and Means, Subcommittee on Health, Hearing on “Why Health Care Is Unaffordable: Anticompetitive and Consolidated Markets,” May 17, 2023.
  29. Commonwealth Fund Commission on a National Public Health System, Meeting America’s Public Health Challenge: Recommendations for Building a National Public Health System That Addresses Ongoing and Future Health Crises, Advances Equity, and Earns Trust (Commonwealth Fund, June 2022).
  30. Justin Giovannelli, Rachel Schwab, and Kevin Lucia, “State Efforts to Standardize Marketplace Health Plans Show How the Biden Administration Could Improve Value and Reduce Disparities,” To the Point (blog), Commonwealth Fund, July 28, 2021.
  31. Richard M. Scheffler, Daniel R. Arnold, and Christopher M. Whaley, “Consolidation Trends in California’s Health Care System: Impacts on ACA Premiums and Outpatient Visit Prices,” Health Affairs 37, no. 9 (Sept. 2018): 1409–16; and Brent D. Fulton, Daniel R. Arnold, and Richard M. Scheffler, “Market Concentration Variation of Health Care Providers and Health Insurers in the United States,” To the Point (blog), Commonwealth Fund, July 30, 2018.
  32. Cory Capps, David Dranove, and Christopher Ody, “The Effect of Hospital Acquisitions of Physician Practices on Prices and Spending,” Journal of Health Economics 59 (May 2018): 139–52.
  33. Commonwealth Fund Commission on a National Public Health System, Meeting America’s Public Health Challenge: Recommendations for Building a National Public Health System That Addresses Ongoing and Future Health Crises, Advances Equity, and Earns Trust (Commonwealth Fund, June 2022).
  34. Eric C. Schneider et al., Mirror, Mirror 2017: International Comparison Reflects Flaws and Opportunities for Better U.S. Health Care (Commonwealth Fund, July 2017); and Eric C. Schneider et al., Mirror, Mirror 2021 — Reflecting Poorly: Health Care in the U.S. Compared to Other High-Income Countries (Commonwealth Fund, Aug. 2021).
  35. Members of the 2024 advisory panel include: Tom Rice, Melinda Buntin, Richard Frank, Michael Kidd, Niek Klazinga, Irene Papanicolas, and Nana Twum-Danso.
  36. Munira Z. Gunja et al., The Cost of Not Getting Care: Income Disparities in the Affordability of Health Services Across High-Income Countries — Findings from the Commonwealth Fund 2023 International Health Policy Survey (Commonwealth Fund, Nov. 2023); Munira Z. Gunja et al., Stressed Out and Burned Out: The Global Primary Care Crisis — Findings from the 2022 International Health Policy Survey of Primary Care Physicians (Commonwealth Fund, Nov. 2022); and Reginald D. Williams II et al., The Impact of COVID-19 on Older Adults: Findings from the 2021 International Health Policy Survey of Older Adults (Commonwealth Fund, Sept. 2021).
  37. Munira Z. Gunja et al., The Cost of Not Getting Care: Income Disparities in the Affordability of Health Services Across High-Income Countries — Findings from the Commonwealth Fund 2023 International Health Policy Survey (Commonwealth Fund, Nov. 2023), table.
  38. Neil J. MacKinnon et al., “Mapping Health Disparities in 11 High-Income Nations,” JAMA Network Open 6, no.7 (July 7, 2023): e2322310.
  39. Organisation for Economic Co-operation and Development (OECD), Avoidable Mortality: OECD/Eurostat Lists of Preventable and Treatable Causes of Death (Jan. 2022 version).

Publication Details

Date

Contact

Reginald D. Williams II, Vice President, International Health Policy and Practice Innovations, The Commonwealth Fund

[email protected]

Citation

David Blumenthal et al., Mirror, Mirror 2024: A Portrait of the Failing U.S. Health System — Comparing Performance in 10 Nations (Commonwealth Fund, Sept. 2024). https://doi.org/10.26099/ta0g-zp66