
Advanced Search

Advanced Search

Current Filters

Filter your query

Publication Types

Other

to

Fund Reports

/

Hospital Global Budgeting: Lessons from Maryland and Selected Nations

Entrance of hospital

The entrance of Baltimore’s Johns Hopkins Hospital pictured on November 20, 2020. Maryland has utilized hospital global budgeting for a decade, but the approach is rarely used elsewhere in this country. The Centers for Medicare and Medicaid Services hopes to test global budgeting in more states to scale up this form of cost containment. Photo: Al Drago/Bloomberg via Getty Images

The entrance of Baltimore’s Johns Hopkins Hospital pictured on November 20, 2020. Maryland has utilized hospital global budgeting for a decade, but the approach is rarely used elsewhere in this country. The Centers for Medicare and Medicaid Services hopes to test global budgeting in more states to scale up this form of cost containment. Photo: Al Drago/Bloomberg via Getty Images

Toplines
  • Global budgets can curb rising health care costs by incentivizing hospitals to reduce unnecessary utilization and run more efficiently, but models must be simple and comprehensible for providers

  • Whether to include certain physician specialties and services in the global budget is a crucial decision that affects whether the providers making clinical choices and performing procedures are aligned with those who manage resources

Authors

Abstract

  • Issue: Maryland has utilized hospital global budgeting for a decade, but the approach is rarely used elsewhere in this country. The Centers for Medicare and Medicaid Services now hopes to test global budgeting in more states to help scale up this form of cost containment.
  • Goals: Examine the ways Maryland, Canada, the Netherlands, New Zealand, and Norway employ hospital global budgeting and the lessons they offer to those hoping to see wider adoption in the United States.
  • Methods: Analysis of the various health systems and expert interviews.
  • Key Findings and Conclusion: Maryland and the four selected countries vary significantly in their approaches to hospital global budgeting. With its previous experience using price controls and current global budgeting approach, Maryland has succeeded in holding hospital spending growth steady for nearly a decade. While Norway combines fixed and variable payments to support global budgeting, the Netherlands and Canada’s province of Ontario are moving away from global budgeting in favor of other approaches. Meanwhile, New Zealand has added multiyear rolling forecasts and budgets to support its own model. Future approaches in the U.S. could prove more effective by factoring in the complexities, conflicting incentives, and potential unintended consequences of global budgeting.

Introduction

In hospital global budgeting arrangements, a payer or a regulator sets a total amount for patient care revenue that a hospital may receive over a year’s time. As a form of value-based payment, global budgeting is one tool private and public payers may use to control hospital spending, the largest line item in their benefits packages.

Global budgeting gives payers stability and predictability of annual spending, plus the opportunity to leverage buying power to limit yearly spending growth. Hospitals not only benefit from having their revenue assured, but they also profit if they reduce volume by preventing unnecessary hospitalizations and running at peak efficiency.1

Some other high-income nations have led in adopting hospital global budgeting. These countries have viable platforms for global budgeting, in that their central governments furnish, or govern, most health care coverage for most people.

In the United States, with its panoply of payers using proprietary payment methods, global budgeting has been confined to a few demonstration programs run by the Centers for Medicare and Medicaid Services (CMS). The largest one is in the state of Maryland, where global budgeting applies to all revenues of all general acute care hospitals. The CMS Innovation Center is rolling out a new model, called AHEAD (States Advancing All-Payer Health Equity Approaches and Development), a major aim of which is to promote global budgeting in more states.2 Maryland itself has applied to CMS to transition to the AHEAD model beginning as soon as 2026.3

This report will explain the fundamentals of the current Maryland global budgeting model and profile four international models to see what lessons they offer for deploying this form of payment more broadly in the U.S.

Global Budgeting’s Role in the Journey from Volume to Value

U.S. hospitals have long derived revenues primarily through production: by delivering more care, they earn more income. Such fee-for-service (FFS) payment is prevalent in employer-sponsored insurance, which covers half of Americans. Medicare, which covers one in five Americans, still uses FFS for the half of its beneficiaries who have not enrolled in prepaid health plans.

Medicare’s hospital payment scheme — called “prospective payment” because it uses preset fixed prices for inpatient stays (“diagnosis-related groups,” or DRGs) and for outpatient visits — incentivizes hospitals to discharge patients more quickly and to use resources more efficiently. It does not, however, remove the incentive for hospitals to admit more patients. No wonder then, that Medicare, plus other payers, might prefer global budgeting, which does not reward providers for delivering more care.

Maryland: A Real-World Experiment in Global Budgeting

Maryland, home to 6 million people, has a demonstration contract with CMS through which hospitals operate under global budgets set by a state regulator, the Health Services Cost Review Commission (HSCRC).4 Today, $22 billion per year of hospital revenues is under HSCRC’s authority. For the past 10 years, the model has performed favorably, though not without continual course correction by CMS, HSCRC, and hospitals.

Hospital Price Controls Preceded Global Budgeting

Starting in the 1970s, about half the states tried regulating hospital prices, but all except Maryland eventually abandoned the practice. In 1977, the federal government gave Maryland a waiver empowering HSCRC to set hospital prices for Medicare. To keep the waiver, Maryland had to pass a yearly test: hold cumulative growth in Medicare payments per case below the national growth rate of Medicare payments.5

Shortly after the 2010 passage of the Affordable Care Act, Maryland was at risk of failing the test. The state and CMS agreed to fold the waiver into a demonstration under the auspices of the newly created Innovation Center. Called the All-Payer Model, the novel approach continued all-payer regulated pricing and introduced all-payer global budgets for general hospitals. Although the All-Payer Model was voluntary for hospitals, every hospital found good reasons to participate. It ran from 2014 through 2018.

During the term of the All-Payer Model, Medicare non-hospital spending — outside of global budgets and not regulated by HSCRC — rose faster than hospital spending. So, for the next contract (2019–2026) CMS added both statewide and hospital-specific targets for total Medicare spending per beneficiary, and the model was renamed the Total Cost of Care (TCOC) Model.6

Ten Years of Hospital Global Budgets

All 43 general hospitals in Maryland,7 from small-town community hospitals to two major urban academic medical centers, have their annual patient revenues set by HSCRC. In 2014, HSCRC set the first global budgets based on hospitals’ 2013 revenues, accounting for changes to each one’s service mix, population served, and uncompensated care costs for uninsured and underinsured patients. Since then, HSCRC has updated global budgets yearly using the prior year as the base.

For the update, HSCRC first sets a statewide growth percentage reflecting inflation and population growth. HSCRC then gives each hospital its own annual revenue update that may deviate from the statewide figure based on changes to the hospital’s service offerings, market share, performance, and other factors.

What’s in the Global Budget? What’s Not?

Maryland’s global budget includes services provided “at the hospital.” Services of affiliated entities not physically on the hospital campus are paid fee-for-service, outside the global budget. Physician care, even if rendered at the hospital, also is excluded.

Maryland’s promise to CMS to limit growth of all hospital spending to 3.58 percent per year (the predicted rate of growth of state domestic product) also means the sum of all hospitals’ global budgets is, in effect, capped.

HSCRC also approves a set of hospital-proposed unit prices, which are DRG-like case rates for inpatient care and per-visit rates for outpatient care paid by all payers whose insureds use a given service at that hospital.8 Multiplying the set prices by expected utilization yields the global budget figure. To make sure each hospital’s actual revenues match its global budget, intrayear pricing is dynamic. If the volume and mix of services are on track to generate revenue that differs from its global budget, the hospital must adjust its prices accordingly (Exhibit 1).

Atlas_hospital_global_budgeting_maryland_selected_nations_Exhibit_01

Thus, Maryland hospitals have the incentive to bring utilization down, ideally by keeping people in the community healthy and not in need of hospital care — though not by so much that they would undercharge their global budgets. If a hospital persists in undercharging, HSCRC may cut its global budget permanently.

While revenues derived from global budgets mainly go toward patient care operations, some allowance is included for capital expenditures. Hospitals that intend to make major capital investments — to replace an old building, for example — may apply to HSCRC to add extra funding to their rates and global budgets.

Beyond the incentives of global budgets, Maryland features multiple other incentives for hospitals:

  • Medicare Performance Adjustment (1% of Medicare revenues) based on TCOC outcomes; any penalty potentially offset by credit for a hospital’s Care Transformation Initiatives9
  • Quality Based Reimbursement (2% of all-payer revenue) focused on patient experience of care, patient safety, and care outcomes
  • Incentives for reducing hospital-acquired conditions, complications, potentially avoidable utilization, and readmissions.

HSCRC continually adjusts its policies in response to emerging issues. The commission recently launched Revenue for Reform, aimed at hospitals that HSCRC sees as accumulating copious “retained savings.” To avoid having a slice of its global budget taken away, a hospital may invest in state-approved efforts meant to improve the health of people living in the surrounding community. Another policy change HSCRC is contemplating is to incentivize hospitals to reduce avoidable visits to their emergency departments by focusing on patients who visit frequently.

During the first nine years of global budgeting, Maryland succeeded in holding cumulative statewide spending growth for all payers and all general acute care hospitals combined to 28 percent, below the limit of 37 percent (Exhibit 2).

Atlas_hospital_global_budgeting_maryland_selected_nations_Exhibit_02

An independent evaluation of the first three years of Maryland’s current model reported “significant, mostly favorable effects on utilization, spending, and quality-of-care outcomes.” But it cautioned, “Recent increases in non-hospital spending, if they continued to grow, could present a risk to the model’s goal of reducing the total cost of care.”10

Other Nations’ Use of Global Budgeting

Hospital global revenue budgeting is more prevalent in other nations. Surveys done by the Commonwealth Fund and the Organisation for Economic Co-operation and Development (OECD) identify at least 16 developed nations that use global budgeting in some fashion.11

Here, we profile the ways hospitals are paid in four of those countries: Canada, the Netherlands, New Zealand, and Norway (Exhibit 3).12 In Canada, we focus on the most populous province, Ontario, which has the most detailed hospital payment methodology. Sources include reports on the four nations’ health systems plus interviews with 12 experts in those countries.13

Atlas_hospital_global_budgeting_maryland_selected_nations_Exhibit_03

Canada (Ontario)

Canada’s national government sets the health care coverage framework (“Medicare”), and each of the 13 provinces and territories provides health insurance for its population, aided by a federal financial contribution. Voluntary private insurance pays for services not covered by Medicare, such as physical rehabilitation, outpatient prescriptions, dental, and vision. Hospitals are private not-for-profit entities.

In provinces such as British Columbia and Alberta, hospitals receive flat annual allotments of operating funds from regional health authorities. These global budgets typically carry over from one year to the next, sometimes adjusted for inflation, population changes, and differences in teaching or tertiary care responsibilities. The provincial health authorities have little visibility into hospitals’ internal costs, service mix, or volume, and they do not use such information in setting the global budgets. Hospitals see it as a “black box” calculation, because the process lacks transparency.

In Ontario, where annual hospital spending totals about CAN 22 billion (USD 16 billion), a 2010 law spurred payment reform including Patient-Based Funding (PBF) for some 75 larger hospitals (half of the facilities in the province). The reform made fixed global budgets just 30 percent of a hospital’s target revenue.14 PBF makes 70 percent of a hospital’s revenue target variable. It has two components: the Health-Based Allocation Model (HBAM), meant to generate 40 percent of the hospital’s revenue, and Quality-Based Procedures (QBP), meant to produce the remaining 30 percent.

Funding Ontario’s Smaller Hospitals

Small hospitals, as defined by caseload, as well as mental health facilities, remain mostly under fixed global budgets in Ontario. As in the rest of Canada, where small facilities often are the only source of care for people in outlying communities, a hospital that struggles under its global budget can expect to get government help to improve performance and, if still needed, financial aid.

HBAM combines population characteristics and clinical/health data, applied to select hospital services, including inpatient and day surgery, emergency, complex continuing care, and inpatient mental health and physical rehabilitation. Using the HBAM formula, Ontario allocates a fixed sum of money among all hospitals based on their respective shares of total hospital expenses across the province. This approach is supposed to reward hospitals for performing efficiently.

QBPs are somewhat like the DRGs used in the U.S. Medicare program — fixed case rates that cover everything a patient receives during a hospital stay, such as for a knee replacement or an acute admission for pneumonia or hip fracture. QBPs are meant to reflect patient complexity and quality of care. The province has established approximately 50 QBPs to date.

Hospitals receive QBP payments on a price x volume basis, where the unit price is set by the Ministry of Health and Long-Term Care and does not differ from one hospital to the next. The ministry adjusts ultimate distributions to hospitals by applying a case mix index that reflects differences among hospitals in complexity and patient acuity.

Of note, the ministry has not raised the QBP unit prices since first setting them a decade ago. So, hospitals have demanded that the ministry boost the fixed global budget component to cover rising costs from inflation.

The Netherlands

Before the 2006 passage of the Health Insurance Act, health care coverage for the Dutch population was a mix of government-administered social insurance and private insurance for those who could afford it. The system was reformed according to the principles of managed competition, a model that was popularized in attempts to reform health care in the U.S. in the 1990s.15

Today, enrolling in health insurance is compulsory for everyone, and private nonprofit insurers provide the coverage.16 The Ministry of Health specifies a standard benefit package, premiums are community-rated, and no one can be denied coverage. The government pays the full cost for children up to age 18; adults’ premiums are funded by a combination of employer, individual, and government contributions. The market has become more concentrated with only 11 insurers at present, down from 24 in 2016. In fact, four insurers command about 90 percent of the business.

Insurers do little selective contracting, so virtually all hospitals participate with all insurers. There is no unified, or all-payer, global revenue budgeting. As a general practice, each insurer negotiates its own annual global budget with each hospital. Global budgets are built based upon some 4,400 DRG-like case rates called diagnosis-treatment combinations (DBCs). Maximum prices for about one-third of DBCs — emergency cases and organ transplants, for example — are set by the Ministry of Health. The rest are determined by the individual insurers and hospitals in their negotiations. In general, DBC values are set and adjusted using a simple top-down methodology that is not derived from hospital cost data.

Hospital quality of care is meant to be a factor in payment negotiations but is rarely used. There is public reporting of selected quality measures and waiting lists that consumers can view online to compare hospitals.17 Transparency is a hallmark of the Dutch system.

Payments to hospitals encompass the cost of specialist physician services. Specialists in academic medical centers are mostly salaried. Elsewhere, specialists organize in group practice entities. Hospitals pay the groups on a fee-for-service basis, though the fees are debited against annual global targets negotiated in advance. In effect, the hospitals pass their global budget risk for specialty physician spending through to the groups.

There are some variations and exceptions to hospital global budgeting. Add-on payments may be made for hospitals that administer very-high-cost drugs. Academic medical centers are eligible to receive add-ons for adopting innovative technologies. Bundled payments are emerging for a few specific types of episodes of care (maternity cases, for example) and would be carved out from global budgets.

Also, one expert interviewed for this report remarked that adherence to global budgets is diminishing, and that payment is becoming more activity-driven in the Netherlands.

New Zealand

New Zealand has a largely nationalized system of coverage and care. Publicly funded health coverage is automatic for permanent residents and accounts for about 80 percent of all health spending. Voluntary private insurance plans offer supplemental coverage and easier access to private, nonurgent specialty care.

Reforms launched in 2022, intended to promote coordination and efficiency, shifted responsibility for managing publicly run health care delivery from 20 quasi-independent district health boards to a national agency, Te Whatu Ora — Health New Zealand. Some 40 hospitals operate under its control. Those hospitals, along with associated specialty-care providers, consume just over half of NZD 26 billion (USD 16 billion) in total annual governmental health expenditures.

New Zealand also has several dozen small private hospitals that primarily offer low-acuity elective surgeries and maternity care; they draw about 6 percent of total health spending, almost entirely from private insurance and direct payments by patients.

Hospitalization Seen as System Failure

New Zealand’s reform program places great emphasis on wellness, primary care, and chronic disease management. Te Whatu Ora leaders feel a cradle-to-grave responsibility for population health. Hospitals do not own this duty, but they are included in regional integration teams tasked to steer resources toward preventive and early intervention measures. Like many countries, New Zealand faces a severe shortage of primary care physicians, so it is looking to allied practitioners to fill the gap.

One effect of the reform is that more than 90 percent of information needed for budgeting is now consolidated into one financial management system. The nation has not yet been able to fund investment in interoperable electronic health records, however.

Before reform, public hospitals were given budgets by their respective district health boards, based primarily on historical usage and projections of population health needs. Nationwide, Te Whatu Ora is moving to rolling multiyear forecasting and budgeting, so budgets will be updated on an ongoing basis. Allocations for individual hospitals — effectively, their global budgets — will be determined based on inpatient, outpatient, and operating room activity levels, both past and projected, along with labor costs and inflation. Hospitals’ budgets include costs of specialty care physicians, who are salaried, though many specialists also have separate private practices.

Norway

Norway has a system of universal, compulsory health care coverage funded and administered by the national government in concert with municipalities. Public financing of health care, at more than 85 percent of total spending, is the highest of all 51 nations in the World Health Organization’s European region, and total health expenditures as a share of gross domestic product (GDP) are the fifth highest.18 Private insurance does exist, mainly offering speedier access to private specialists, but it accounts for less than 3 percent of all health spending.

Municipalities organize and run primary care and other basic services. The national government funds specialized care including hospital services. Its Ministry of Health and Care Services governs four regional health authorities that own and control 20 hospital trusts. The hospitals either employ specialty care physicians or contract for their services on a lump-sum basis.

Hospital funding starts with the parliament budgeting annually for health care spending. The ministry apportions that budget among the regional health authorities based on population characteristics and health needs. Each regional health authority splits its hospital spending budget among its hospitals and has latitude to pay hospitals mostly as it chooses, though they all use the same methodology.

Before 1980, hospitals in Norway were compensated on a per diem basis, with fixed daily rates for services provided. Block grants (fixed global budgets) were used from 1980 to 1997. Since then, a combination of fixed and variable payments has been in operation.

The fixed component is a block grant that amounts to 60 percent of the target global budget. The remaining 40 percent of funding is activity-dependent, using DRG-style case payments. The expectation is that the hospital will deliver a quantity and mix of services that will bring its revenues to within 1 percent to 2 percent of its global budget. The regional health authorities customarily set high activity targets relative to hospitals’ actual capacity, however, so few hospitals ever realize their full potential global budget revenues.

Quality-based payments were introduced in 2014 and amount to just 0.5 percent of hospital funding. Quality measures focus on patient experience of care.

In theory, at least, a hospital that strives to build up volume may receive little extra money if actual activity exceeds the target. However, under limited circumstances, such as if a hospital sees an extraordinary caseload and other hospitals in the region do not reach their budgeted variable pay levels, the regional health authority may grant it more funding.

Generally, Norway’s hospital trusts fund capital investment out of their regular allocations from the regional health authorities. For large capital projects, a trust may apply to the ministry for 70 percent of the funding.

Comparison of Global Budgeting Approaches

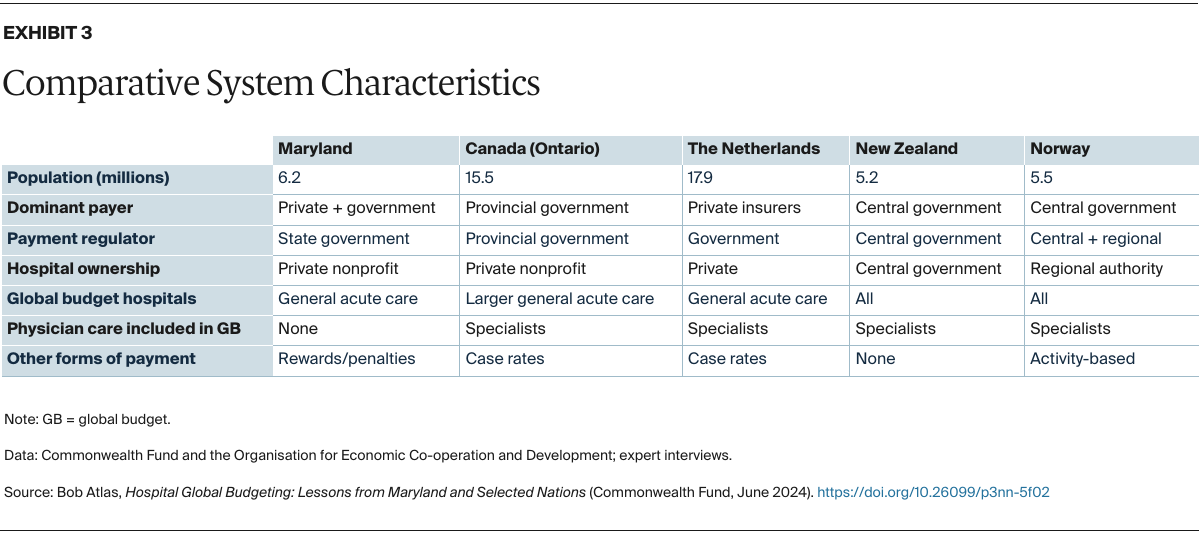
To borrow from an old adage: When you’ve seen one nation’s hospital global budgeting scheme, you’ve seen one nation’s hospital global budgeting scheme. Comparing the five global budgeting models described above demands understanding the characteristics of their broader health care financing and delivery systems.

Where Government Runs Everything

The national governments of New Zealand and Norway both own the facilities that deliver almost all hospital care and fund health coverage using social insurance. So, for those countries, hospital global budgeting could be equated to departmental budgeting within a single corporation. No negotiation is needed between independent parties.

Total funding for hospitals and methods of allocation to individual hospitals reflect national sentiment about what is most important in both nations. New Zealand’s government aims to redirect resources to prevention and primary care, hoping to lessen the need for acute and curative hospital care. Norway also prizes prevention, plus social supports that boost well-being, such as childcare and housing. Another priority is to ensure access to the full range of care for the 20 percent of Norwegians who live well outside the urban areas. Efficiency is certainly desired, but is not given the most weight, as reflected by Norway’s comparatively high investment in health care.

Where Hospitals Are Privately Owned

In Canada, the Netherlands, and Maryland, almost all hospitals are private nonprofit institutions that operate at arm’s length from the government. Yet they depend on government for much of their funding and are regulated by government in many respects. A common thread in all three cases is that hospitals assertively advocate for their interests.

There are clear differences, though. Canada’s federal and provincial governments provide social insurance to pay for health care. In the Netherlands, private nonprofit health insurers — heavily regulated by the national government, which also contributes more than half of all premiums — bear the insurance risk and pay for care. In Maryland, health insurance is furnished by multiple public and private insurers, and the state has a statute and special federal government dispensation to regulate how all those payers pay hospitals.

In Ontario, the Netherlands, and Maryland, hospital global budgeting takes different forms, and all three of their programs are continually evolving.

Experience Drives Changes to Payment Policies

Since 2012, Ontario has pointedly moved away from the classic model of global budgeting, believing that it stifled provider initiative and innovation. Ontario’s health system funding reform was meant to “strengthen the link between the delivery of high-quality care and fiscal sustainability.”19 So now, hospital payment in the province is only about one-third fixed. The rest is variable, partly to reward the more efficient hospitals and partly to acknowledge intrayear differences in hospital volumes.

Hospital representatives in Ontario nevertheless point to the funding model as a cause of capacity limits and associated waiting lists for many procedures. Rapid population growth in recent years stemming from international immigration further strains hospitals’ finances.

In the Netherlands, all-encompassing fixed global budgets were discarded in 2006 along with the dismantling of the single-payer system. Now, competing insurers negotiate independently with hospitals to set global budgets based on their own price schedules and utilization forecasts, somewhat like capitation — which involves a fixed prepayment per person per unit of time — but without the prepayment feature. Additionally, there are signs that global budgets in the Netherlands are becoming more like targets than definitive commitments.

For the past 50 years in Maryland, a state commission has regulated hospital prices as if it were a single payer, despite the state’s multiplicity of payers. For the past decade, it also has set hospital global budgets. It also regularly introduces new policies, many that change the outcome of the global budget, to improve patient satisfaction and quality of care or to reduce emergency department overcrowding. And five years ago, a small amount of risk, just 1 percent of a hospital’s Medicare revenue, was added to motivate hospitals to control nonhospital spending.

The Maryland model has some distinctive wrinkles, which may also manifest in the other countries. First, individual hospitals that believe their global budgets are unfavorable can appeal their global budget in whole by filing a “full rate application” with the commission. Or they can ask the regulator to recognize certain extraordinary costs incurred to protect patients’ access to vital services.

At the same time, however, if a Maryland hospital begins to appear redundant, such as if utilization falls and there is another hospital nearby that could meet all the community’s needs, there is little incentive for the owner to downsize or close the facility. Doing so amounts to giving up revenue that is virtually guaranteed.

Perhaps the most prominent feature all five systems have in common is a constant drive for change. Every one of these payment systems has undergone major modifications since the beginning of this century, and all are continually scrutinized for opportunities to do better.

Financial sustainability is a key driver of change, whether for the funder or the hospitals, or both. Access to quality care for all residents is another motivator — concerns arise everywhere about patients’ long waiting times, growing travel distances for specialized care, and slow adoption of worthy technological innovations. Leaders broadly also recognize the importance of keeping the population healthy and changing the focus away from the curative care model.

Lessons for U.S. Policy

The U.S. government right now is grappling with issues related to patient access, population health, and financial sustainability, as are many states. In a recent publication pertaining to the AHEAD model, CMS gave this rationale (paraphrased) for promoting global budgeting wherever hospital revenue is now tied to fee-for-service payment:

Global budgets are a critical tool for containing cost growth, improving hospital quality, and generating revenue needed to invest in population health, primary care, behavioral health, and health equity. Where fee-for-service may promote overuse of services, duplication of complex services, or overinvestment in facilities and technology, global budgets give hospitals — including rural and urban safety-net hospitals — financial stability and flexibility. Global budgets also encourage hospitals to reduce avoidable care and to join with other health care providers and public health agencies to improve the health of the populations they serve.20

Our observations on several hospital global budgeting systems do not conflict with that rationale. However, our assessment also provides several considerations for next-generation global budgeting models:

  • Global budgeting models must be simple and comprehensible for providers. Incentives do not work if the institutions and the people whose conduct is supposed to change cannot appreciate the benefits of making the change. This is especially true in the postpandemic era, when tightened resources and higher workforce turnover cut into opportunities for learning and change management.
  • Choosing the right services to include in the global budget is important for promoting desired outcomes. Whether to put certain physician specialties and services in the global budget is a crucial decision. It affects whether providers who make clinical choices and perform procedures are aligned with those who manage resources.
  • Thanks to technological advancements, many services that hospitals provide can be delivered no less safely in freestanding ambulatory care settings and even at patients’ homes. Global budgeting systems must be refreshed continually to reflect such changes.

Conclusion

Global budgeting can be a powerful tool for controlling hospital spending growth, encouraging preventive care in favor of acute curative care, and assuring hospitals of predictable revenue streams. Policymakers, however, will need to consider real differences between hospitals, including their varying capabilities and the distinct health needs of the populations they serve. And they will need to prevent free ridership by hospitals that find themselves advantaged not by doing better but simply by the way the rules work.

NOTES
  1. Some observers equate global budgeting to capitated payment. Global budgeting differs from capitation, though, in that there is no enrollment-style mechanism that formally binds each covered individual to any given hospital.
  2. Centers for Medicare and Medicaid Services, “States Advancing All-Payer Health Equity Approaches and Development (AHEAD) Model,” n.d., accessed Apr. 17, 2024.
  3. Letter from Maryland Governor Wes Moore to Elizabeth Fowler, deputy administrator and director for the Center for Medicare and Medicaid Innovation, Centers for Medicare and Medicaid Services, Mar. 18, 2024.
  4. The Health Services Cost Review Commission is quasi-independent. The governor appoints its seven commissioners, but the commissioners’ decisions cannot be overridden by elected officials. See Health Services Cost Review Commission, “HSCRC Overview,” n.d., accessed Apr. 17, 2024.
  5. Robert Murray and Robert A. Berenson, Hospital Rate Setting Revisited (Urban Institute, Nov. 2015). This is also the source for additional portions of the description of Maryland’s rate setting through 2013.
  6. Global budgets apply to all payers, while the Total Cost of Care (TCOC) model pertains only to Medicare. Within Medicare, TCOC is limited to Parts A and B spending; Part C (Medicare Advantage) beneficiaries are not counted, and Part D (outpatient drugs not covered by Part B) is excluded.
  7. Excludes specialty hospitals and facilities formerly operated as inpatient hospitals that are now outpatient only. See Maryland Hospital Association, “Member Systems and Hospitals,” n.d., accessed Apr. 17, 2024.
  8. Medicare and Medicaid get a 7.7 percent discount. Even so, Medicare pays hospitals more in Maryland than it would pay absent the waiver. CMS hopes quality of care and health outcomes will improve, and it realizes savings based on comparative trends, not absolute dollars in real time.
  9. Care Transformation Initiative categories include patient care transitions, palliative care, primary care transformation, community-based care, and mobile integrated health. See Health Services Cost Review Commission, Care Transformation Initiative: Frequently Asked Questions (HSCRC, n.d., accessed Apr. 17, 2024).
  10. Jason Rotter, Keri Calkins, and Kate Stewart, Evaluation of the Maryland Total Cost of Care Model: Quantitative Only Report for the Model’s First Three Years (2019 to 2021) (Mathematica, Dec. 2022).
  11. Roosa Tikkanen et al., 2020 International Profiles of Health Care Systems (Commonwealth Fund, Dec. 2020); Valerie Paris, Marion Devaux, and Lihan Wei, Health Systems Institutional Characteristics: A Survey of 29 OECD Countries (Organisation for Economic Co-operation and Development, Apr. 2010); and Organisation for Economic Co-operation and Development, “Health Systems Characteristics Survey,” n.d. (source for 2016 data).
  12. Selection was made by screening for different characteristics in their health systems and giving special consideration to countries that participate in the Commonwealth Fund’s Harkness Fellowship program.
  13. In addition to the interviews conducted by the author and any specific references cited for individual nations, sources include those referenced above for the Commonwealth Fund and OECD. Another resource is: Organisation for Economic Co-operation and Development and European Observatory on Health Systems and Policies, Country Health Profiles (OECD and Observatory, n.d.).
  14. Ontario Hospital Association has multiple reference materials on its approach for payment reform, known as Health System Funding Reform (HSFR). See Ontario Hospital Association, “HSFR Resources,” n.d., accessed Apr. 17, 2024.
  15. A 2006 law put an end to the original social insurance system. For an important early discussion of managed competition, see Alain C. Enthoven, “The History and Principles of Managed Competition,” Health Affairs 12, no. 1 suppl. (Jan. 1, 1993): 24–48.
  16. An interviewee described it for the American author as “Medicare Advantage for everyone.”
  17. National Health Care Institute (the Netherlands), “The Dutch Health Care System,” n.d.
  18. For figures from 2017, see Ingrid S. Saunes, Marina Karanikolos, and Anna Sagan, Norway: Health System Summary 2022 (European Observatory on Health Systems and Policies, June 2022).
  19. Ontario Hospital Association, “HSFR Resources,” n.d., accessed Apr. 17, 2024.
  20. Centers for Medicare and Medicaid Services, Center for Medicare and Medicaid Innovation, States Advancing All-Payer Health Equity Approaches and Development (AHEAD) Model: Financial Specifications for the CMS-Designed Medicare FFS Hospital Global Budget Methodology — Version 1.0 (CMS, last modified Feb. 12, 2024).

Publication Details

Date

Contact

Bob Atlas, President, Grace Creek Advisors

Citation

Bob Atlas, Hospital Global Budgeting: Lessons from Maryland and Selected Nations (Commonwealth Fund, June 2024). https://doi.org/10.26099/p3nn-5f02