
Advanced Search

Advanced Search

Current Filters

Filter your query

Publication Types

Other

to

Surveys

/

Paying for It: How Health Care Costs and Medical Debt Are Making Americans Sicker and Poorer

Findings from the Commonwealth Fund 2023 Health Care Affordability Survey
Photo, woman types at computer with paperwork

Laine Carolyn goes through eviction paperwork and medical bills at her home in Alexandria, Va., on March 15, 2023. Our recent study shows that many Americans have inadequate health insurance coverage that’s led to delayed or forgone care, significant medical debt, and worsening health problems. Photo: Stefani Reynolds/AFP via Getty Images

Laine Carolyn goes through eviction paperwork and medical bills at her home in Alexandria, Va., on March 15, 2023. Our recent study shows that many Americans have inadequate health insurance coverage that’s led to delayed or forgone care, significant medical debt, and worsening health problems. Photo: Stefani Reynolds/AFP via Getty Images

Toplines
  • Large shares of working-age adults say they struggle to afford health care, including 43 percent of those with employer coverage, 57 percent with marketplace or individual plans, and 45 percent with Medicaid

  • For many Americans, health insurance isn’t protecting them from taking on medical debt

The Commonwealth Fund Health Care Affordability Survey, fielded for the first time in 2023, asked U.S. adults with health insurance, and those without, about their ability to afford their health care — whether costs prevented them from getting care, whether provider bills left them with medical debt, and how these problems affected their lives.

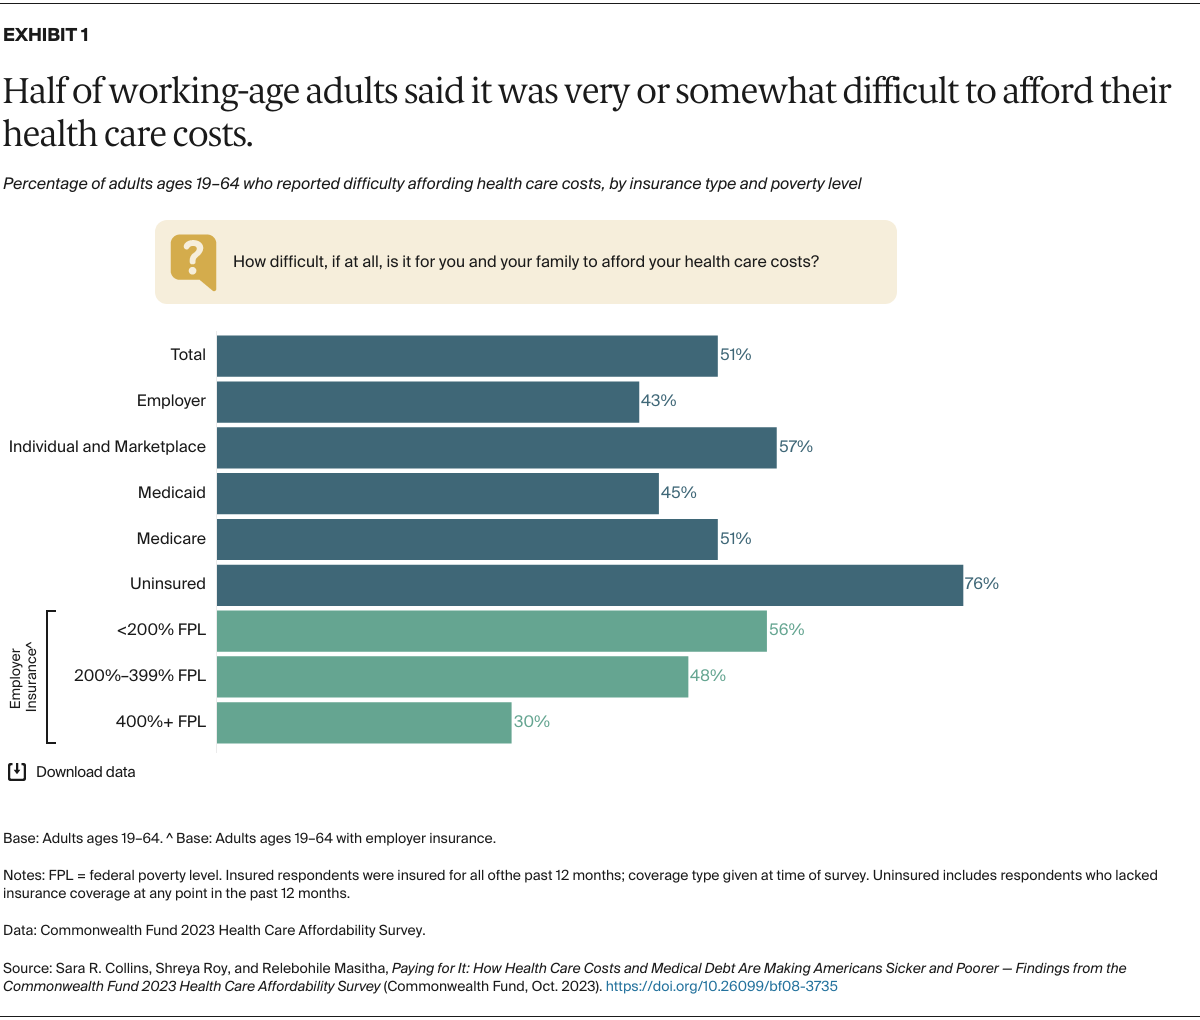
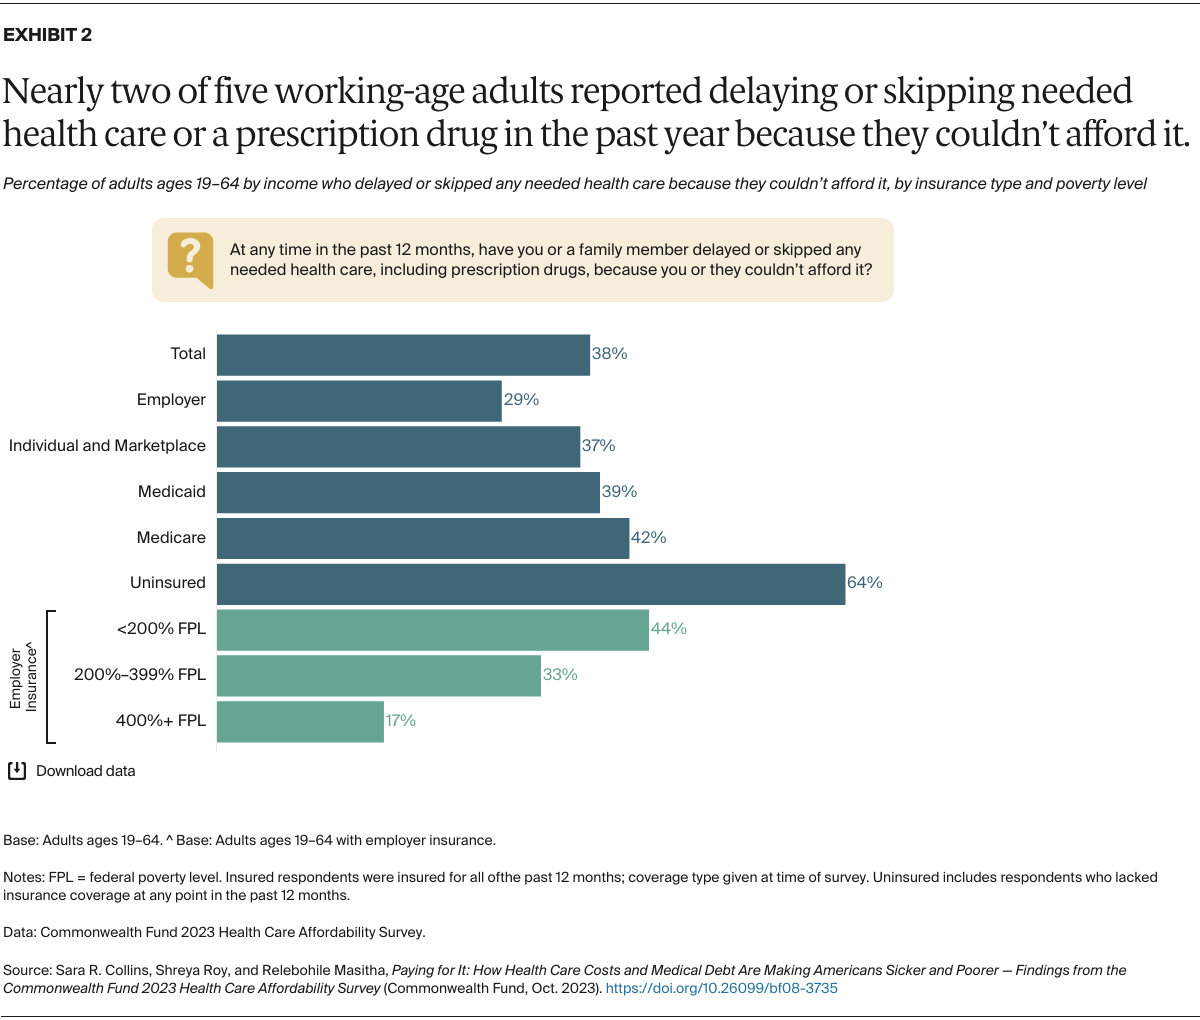
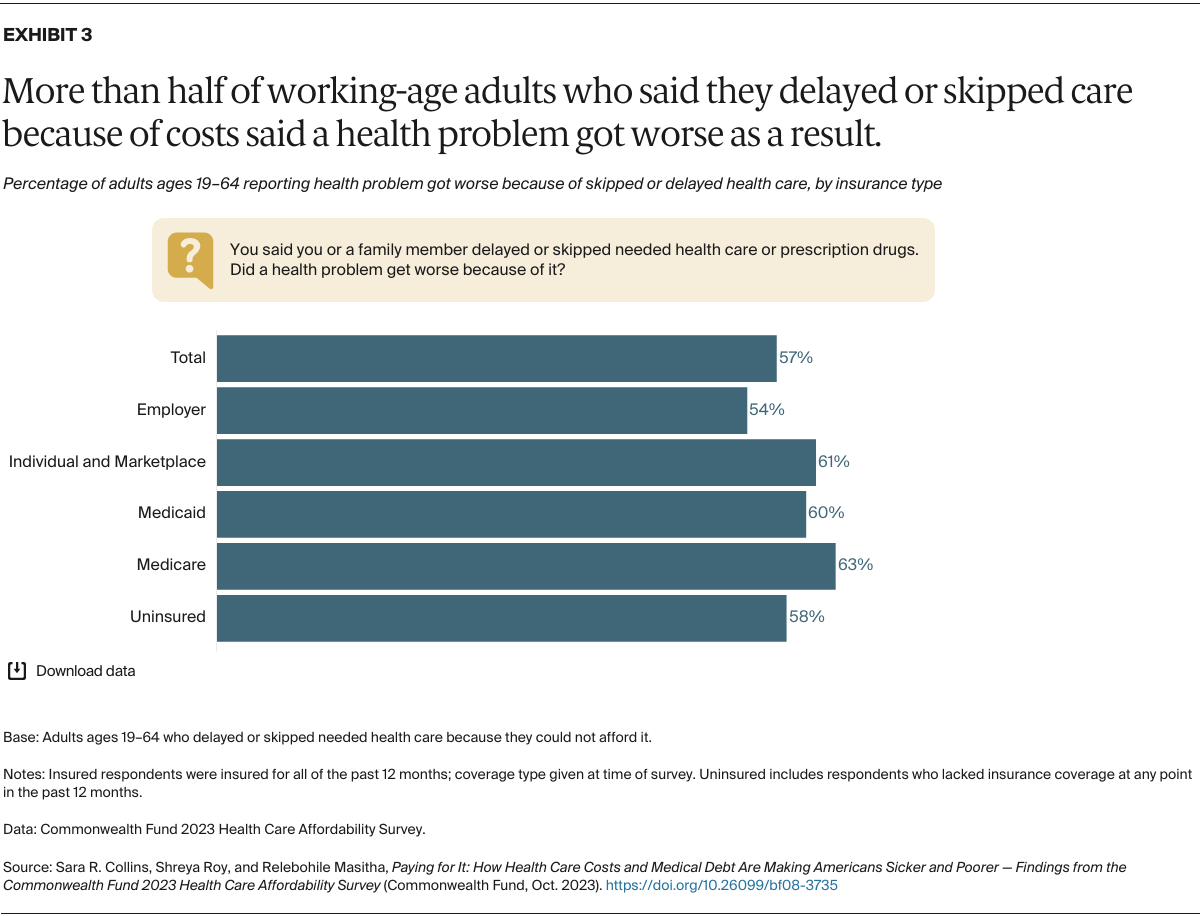
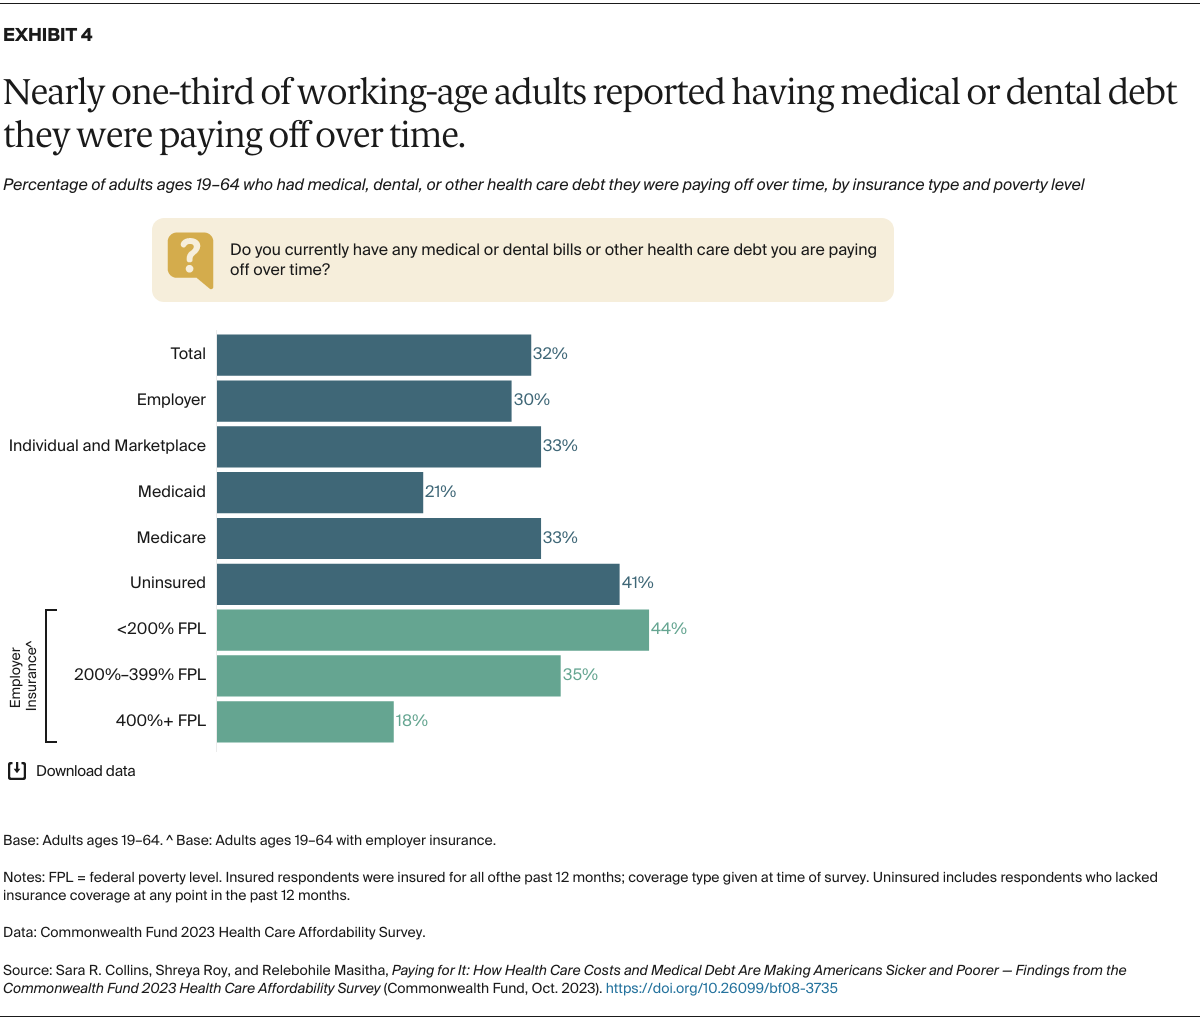
As the responses show, many Americans, regardless of where their insurance comes from, have inadequate coverage that’s led to delayed or forgone care, significant medical debt, and worsening health problems. While having health insurance is always better than not having it, the survey findings challenge the implicit assumption that health insurance in the United States buys affordable access to care. Difficulties affording care are experienced by people in employer, marketplace, and individual-market plans as well as people enrolled in Medicaid and Medicare.

In this brief, we present findings for survey respondents who were insured for the full year and those who spent all or part of the year uninsured. People who were insured all year are grouped by the coverage source they reported at the time of the survey, though it should be noted that some may have switched insurance during the year.

For the survey, SSRS interviewed a nationally representative sample of 7,873 adults age 19 and older between April 18 and July 31, 2023. Our analysis focuses on 6,121 respondents of working age, those 19 to 64. To learn more about the survey, see “How We Conducted This Survey.”

Survey Highlights

  • Large shares of insured working-age adults surveyed said it was very or somewhat difficult to afford their health care: 43 percent of those with employer coverage, 57 percent with marketplace or individual-market plans, 45 percent with Medicaid, and 51 and percent with Medicare.
  • Many insured adults said they or a family member had delayed or skipped needed health care or prescription drugs because they couldn’t afford it in the past 12 months: 29 percent of those with employer coverage, 37 percent covered by marketplace or individual-market plans, 39 percent enrolled in Medicaid, and 42 percent with Medicare.
  • Cost-driven delays in getting care or in missed care made people sicker. Fifty-four percent of people with employer coverage who reported delaying or forgoing care because of costs said a health problem of theirs or a family member got worse because of it, as did 61 percent in marketplace or individual-market plans, 60 percent with Medicaid, and 63 percent with Medicare.
  • Insurance coverage didn’t prevent people from incurring medical debt. Thirty percent of adults with employer coverage were paying off debt from medical or dental care, as were 33 percent of those in marketplace or individual-market plans, 21 percent with Medicaid, and 33 percent with Medicare.
  • Medical debt is leading many people to delay or avoid getting care or filling prescriptions: more than one-third (34%) of people with medical debt in employer plans, 39 percent in marketplace or individual-market plans, 31 percent in Medicaid, and 32 percent in Medicare.

Survey Findings

Collins_paying_for_it_2023_affordability_survey_Exhibit_01

To find out how difficult, if at all, it is to pay for health care expenses, we asked people to consider all costs they and their immediate family members incur: insurance premiums and out-of-pocket costs like copayments and coinsurance; prescription and over-the-counter drugs; dental, vision, and hearing care; home care; and long-term care.

Given the necessity of insurance to defray the full cost of health care in the United States, it shouldn’t come as a surprise that the vast majority of people who had spent some time uninsured during the year would report difficulty affording their health care costs. More surprising is the large share of adults who had insurance all year but still report difficulty paying health care expenses. Forty-three percent of people in employer plans, 57 percent enrolled in marketplace or individual-market plans, 45 percent with Medicaid, and 51 percent with Medicare said it was difficult to afford their health care.

Among people enrolled in employer plans, those with low income especially struggled with health care costs: 56 percent with income under 200 percent of the federal poverty level ($29,160 for an individual and $60,000 for a family of four) reported difficulty paying these costs.

Being in poor health exacerbates problems affording care, even for people covered by Medicare. Those under age 65 who are Medicare-eligible have serious disabilities or health conditions that prevent them from working full time, making them among the poorest and sickest people we surveyed. Because of their low income, many are also eligible for Medicaid.

Collins_paying_for_it_2023_affordability_survey_Exhibit_02

The cost of health services is an insurmountable barrier to getting timely care for most uninsured people. As our survey shows, costs are also a barrier for many people who have insurance. Nearly three in 10 people in employer plans, more than one-third in marketplace or individual-market plans, and about two of five people with Medicaid or Medicare said they or a family member had delayed or skipped needed health care or prescription drugs in the past 12 months because they couldn’t afford it.

Among people in employer plans, those with incomes under 400 percent of poverty ($58,320 for an individual and $120,000 for a family of four) reported much higher rates of care delayed or forgone because of cost compared to those with higher incomes.

Collins_paying_for_it_2023_affordability_survey_Exhibit_03

Fear of incurring health care expenses they can’t afford is endangering the health of many Americans, even those who have insurance. More than half of adults with employer coverage who reported they or a family member had delayed or skipped getting needed care because of costs said a health problem had gotten worse as a result. About 60 percent or more of those in marketplace or individual-market plans, Medicaid, or Medicare said a health condition worsened because of a cost-related delay or skipped care.

Collins_paying_for_it_2023_affordability_survey_Exhibit_04

It’s perhaps no wonder that costs prevent many people from seeking health care: those who do get care often leave the hospital or doctor’s office piled with bills they cannot pay. We asked people whether they or a family member currently had medical bills or debt of any kind that they were paying off over time, including dental, home health, or long-term care. Nearly one-third reported they were paying off health care debt. Insurance coverage failed to protect many people from incurring medical debt. Thirty percent of people in employer plans, 33 percent in marketplace or individual-market plans or in Medicare, and 21 percent in Medicaid said they had medical or dental care debt.

Among people with employer coverage, much higher rates of those with incomes under 400 percent of poverty reported paying off medical debt over time compared to those with higher incomes.

Collins_paying_for_it_2023_affordability_survey_Exhibit_05

Medical debt can have consequences for the health and well-being of entire households. More than three-quarters of people with medical debt reported being anxious or worried about their debt, with similar rates seen for each type of insurance. (Data not shown. See our four fact sheets on employer-based, marketplace or individual-market, Medicaid, and Medicare under age 65 coverage for more detail.)

More than one-third of those reporting medical debt within their household said it had caused a member to delay or avoid getting health needed health care or prescription medications — again, with similar rates seen for all insurance types. Nearly two of five of people with medical debt said they were forced to cut back on basic necessities like food, heat, or rent, while a quarter took on another job or worked more hours to pay off the debt.

Medical debt can have lasting financial consequences. More than a third of people reporting debt said they had used up all or part of their savings to pay it off and/or received a lower credit rating because of it.

Collins_paying_for_it_2023_affordability_survey_Exhibit_06

Most people who have medical debt carry a lot of it: 85 percent reported total debt loads of $500 or more, and nearly half said they were paying off $2,000 or more. This means that among all working-age adults in the United States, an estimated 27 percent are currently carrying medical debt of more than $500, and 15 percent have medical debt loads of $2,000 or more.

While media reports frequently highlight unexpected health care events and emergency room visits that leave people with lots of medical bills, our survey findings suggest that the source of much debt is simply care for chronic health problems. About half of adults with debt said it stemmed from treatment they received for an ongoing condition.

Collins_paying_for_it_2023_affordability_survey_Exhibit_07

National estimates of the total amount of medical debt that Americans owe are based mainly on debt that goes to collection agencies and then appears on consumer credit records. In 2021, there was an estimated $88 billion of medical debt on consumer credit records, accounting for 58 percent of all debt-collection entries on credit reports — by far the largest single source of debt.1 Our survey shows these estimates likely understate the amount of medical bills people are paying off over time: more than two-thirds of respondents with medical or dental debt said that they were making some or all of their payments directly to health care providers.

Collins_paying_for_it_2023_affordability_survey_Exhibit_08

In many households, health care costs take up so much of monthly budgets that they affect the ability of people to pay for other living expenses. And the reverse can also be true: when the cost of other living expenses rises, it can affect families’ ability to pay for their health care.

To understand how health care affects, and is affected by, other demands on people’s budgets, we first asked respondents how much of their budget goes to health care for themselves and their immediate family — including all insurance premiums and out-of-pocket expenses; prescription and over-the-counter drugs; dental, vision, and hearing care; home care; and long-term care. Overall, 57 percent of those surveyed said the cost of their care and their family’s care takes up 10 percent or more of their household budget in an average month.

Collins_paying_for_it_2023_affordability_survey_Exhibit_09

Nearly six of 10 adults with employer coverage and seven of 10 adults in marketplace or individual-market plans said 10 percent or more of their household budget went to health care in an average month. But substantial shares spent more: nearly a quarter of adults in marketplace or individual-market plans and adults in employers plans who were earning less than 200 percent of poverty ($29,160 for an individual and $60,000 for a family of four) reported allocating 25 percent or more of their monthly budget to health care costs.

Collins_paying_for_it_2023_affordability_survey_Exhibit_10

Many respondents said that their health care costs made it harder for them to afford other living expenses. While people without insurance for all or part of the year struggled the most, even people with coverage all year reported problems affording other things. Among those with any type of private insurance (employer, marketplace, or individual-market), 30 percent or more said their health care costs had made it harder for them to pay bills like those for electricity, heating, food, or credit cards. People with Medicaid or Medicare reported similar problems: two of five said their health costs had made it harder to pay food and other household bills.

Collins_paying_for_it_2023_affordability_survey_Exhibit_11

We also asked people whether rapid growth in the cost of other living expenses over the past year had made it harder for them to afford their health care. When asked to consider all their health costs, nearly two-thirds of working-age adults said price inflation in the economy had some or a great deal of effect on their ability to afford their care. Insurance did not appear to protect people sufficiently from the budget squeeze: depending on their coverage, between 60 percent and 74 percent said inflation had affected their ability to afford their health care.

Collins_paying_for_it_2023_affordability_survey_Exhibit_12

We were interested in whether people had considered dropping their health insurance over the past year because of the cost. The results should worry policymakers and employers: 5 percent of surveyed adults said they had dropped their insurance because of the cost and 16 percent had considered dropping it. Rates were highest for people with low income.

Policies That Could Make Health Care More Affordable

Health care costs are deterring many Americans from getting the care they need, with deleterious effects on their health. While our survey’s findings show that it’s much better to have insurance than to go without, they also indicate that insurance frequently fails to provide affordable access to care for large segments of the U.S. population. It’s understandable that even people with insurance avoid getting needed care, since so many leave their provider’s office with bills they could be paying off for years — hampering their ability to get further care, afford basic living expenses, and save for the future.

Policymakers in Congress, the executive branch, and the states have many tools to make health care more affordable for all Americans. Following are some options for them to consider, organized by type of health insurance.

All Insurance

  • Protect consumers from being financially ruined by medical debt. Many states have passed legislation banning aggressive collection activities by hospitals and collection agencies.2 The Biden administration announced in September 2023 that it’s drafting new regulations to prohibit medical debt information from appearing on consumer credit reports; earlier, it had taken steps to ensure greater scrutiny of providers’ bill collection tactics, among other actions.3 State and federal governments could reinforce those actions by increasing patient access to financial assistance; requiring providers to allow debt repayment grace periods following illness or during the appeals process; ending such hospital practices as suing patients, garnishing wages, or placing liens on homes; and banning or placing limits on charging interest.4
  • Lower health care cost growth. The relentless growth in the cost of health care, driven primarily by prices commercial insurers and employers pay to providers and for pharmaceuticals, is at the root of the nation’s medical debt and affordability crisis in commercial insurance. Ultimately, private payers will need to do a better job of leveraging their purchasing power to slow cost growth in commercial markets. Federal and state policymakers could help, such as by creating new public plan options.5

Employer Coverage

  • Adjust premiums and cost sharing based on employee income. In 2022, just 10 percent of employers with 200 or more employees had programs to reduce premium contributions for lower-wage workers; only 5 percent had similar programs to reduce cost sharing.6
  • States, which regulate their fully insured employer markets, could improve coverage in those plans. Rhode Island, for example, used rate regulation to limit growth in premiums and cost sharing.7 States could explore other policies as well, just as many did prior to the Affordable Care Act (ACA) in requiring coverage of young adults on a parent’s plan.8
  • Congress could consider reforms to the ERISA preemption of state laws that regulate employer-based insurance. The federal Employee Retirement Income Security Act of 1974 (ERISA) preempts states from regulating self-insured employers, which employ the majority of Americans. Congress could consider repealing the ERISA preemption, making state insurance law enforceable against self-insured employers, or it could give the U.S. Department of Health and Human Services (HHS) authority to grant preemption waivers to states.9
  • Congress could consider reforms to ERISA itself. In particular, ERISA’s employer fiduciary obligations could be expanded to include providing “meaningful” coverage based on employees’ financial exposure to health costs relative to their income.
  • Congress could increase the ACA’s minimum employer health benefit standards. The ACA requires employers with 50 or more employees to provide insurance that covers at least 60 percent of covered health care costs, on average. But failing to meet that standard only results in a penalty if an employee becomes eligible for a marketplace subsidy. Congress could both increase the minimum standard and broaden its enforcement.

Marketplace and Individual-Market Plans

  • Permanently extend the enhanced marketplace premium subsidies set to expire in 2025. These larger subsidies have dramatically lowered household premiums and led to record enrollment in the marketplaces. If Congress fails to make these enhanced subsidies permanent, marketplace premiums will spike and enrollment will fall, exacerbating the affordability problems highlighted in our survey.10
  • Lower deductibles and out-of-pocket costs in marketplace plans. Congress could extend cost-sharing reduction subsidies to middle-income people and change the benchmark plan in the ACA marketplaces from silver to gold, which offers better financial protection.11 These policies would save households $4.8 billion and decrease the number of uninsured by an estimated 1.5 million.12
  • Standardize benefit designs to include $0 copayments for primary care. Health insurers participating in HealthCare.gov are now required to offer standardized plans.13 HHS could consider adding $0 primary care visits to the plans and requiring all plans at the silver level and above to include this.
  • Ensure narrow provider networks enable access to needed care. The Centers for Medicare and Medicaid Services (CMS) could continue to ensure that narrow provider networks in wide use by marketplace insurers are providing the breadth of health services needed to ensure access and prevent out-of-network costs.14

Medicaid

  • Limit or eliminate cost sharing. For this very-low-income group of people, even relatively modest copayments can dissuade households from getting timely health care or leave them with medical debt.
  • Ensure full Medicaid coverage through retroactive eligibility. A hallmark of Medicaid is that coverage of services begins three months prior to application, protecting people from bills they may have incurred prior to enrollment. One Indiana study found that enrollees averaged $1,561 in health care costs during the retroactive period.15 Several states have received waivers that have reduced or eliminated this provision, but their effects haven’t been systematically evaluated. States and the federal government should consider curtailing use of these waivers and maintaining current policy.16
  • Expand scope of Medicaid coverage. Although state Medicaid programs must cover a certain set of inpatient and outpatient services, they have discretion over whether to cover other critical services such as adult dental and vision care. Coverage varies substantially by state, and utilization limits can leave people unable to meet their needs without incurring out-of-pocket costs. States could adopt more optional services and Congress could increase the number of mandatory services.
  • Expand Medicaid managed care networks and clarify access rules for medically necessary drugs. Like private-plan enrollees, Medicaid enrollees may not have access to in-network providers, leaving them without access or at risk of incurring out-of-network costs. Enrollees also may need prescriptions for drugs that are not on their plan formularies. States and the federal government could require broader networks of participating providers and clarify that enrollees have access to medically necessary drugs not included in their formulary.
  • Increase the personal and maintenance needs allowance for people using long-term services and supports (LTSS). These allowances are the amount of monthly income protected for people receiving LTSS; the rest of their income must go toward LTSS costs. The personal-needs allowance for people in nursing homes has a federal minimum of just $30, while the state median is $50.17 The maintenance-needs allowance, for people receiving home and community LTSS, varies substantially by state and population. Increasing these allowances would be especially important for people living in the community who must pay for rent, utilities, and food.
  • Shorten the medically needy “spend down” period. Medicaid’s Medically Needy Program permits otherwise eligible people whose incomes exceed eligibility limits to qualify if their medical expenses reduce their income below those limits. Thirty-four states offer the program18 with spend-down periods of one to six months. More states could offer the program with shorter spend-down periods, which would reduce costs for people with serious health problems.

Medicare Under Age 65

  • Increase awareness and help people enroll in the Medicare Savings Program. This program helps pay beneficiary Medicare Part B premiums and out-of-pocket costs for Part A and Part B services, making health care more affordable for beneficiaries under age 65 with significant disabilities.
  • Increase awareness and help people enroll in the Part D Low-Income Subsidy program. This program would help make prescription drug costs affordable for more people who are eligible but not enrolled.
  • Improve coordination of benefits between Medicare and Medicaid. Medicare beneficiaries under age 65 with disabilities who are dually eligible for Medicaid face considerable confusion about which program has responsibility for covering needed care. Improving coordination would help lower beneficiaries’ costs.
  • Educate beneficiaries with disabilities who are enrolled in Medicare Advantage plans about plan benefits. Helping these beneficiaries understand the supplemental benefits available in their plans, and how to access those benefits, could enable them to use the services more effectively and at lower cost.

Uninsured All or Part of the Year

  • Limit coverage losses during the unwinding of Medicaid’s continuous eligibility policy. CMS and its state partners will need to continue to closely monitor the massive eligibility redetermination effort that states are undertaking in the wake of the COVID-19 public health emergency. They will need to ensure that people who are no longer eligible for Medicaid get alternative coverage and intervene in states where many people have lost coverage because of procedural reasons.
  • Create a longer period of continuous Medicaid eligibility. Disruption in Medicaid coverage because of eligibility changes, administrative errors, and other factors can leave people uninsured and unable to get care. Congress could apply the lessons of the pandemic and give states the option to maintain continuous enrollment eligibility for adults for 12 months without the need to apply for a waiver — just as has been done for children in Medicaid and the Children’s Health Insurance Program.19
  • Fill the Medicaid coverage gap. Congress could create a federal fallback option for Medicaid-eligible people in the 10 states that have yet to expand Medicaid.20
  • Create an autoenrollment mechanism. Research shows that many uninsured people are eligible for Medicaid or subsidized marketplace coverage. By allowing autoenrollment in comprehensive health coverage, Congress could move the nation closer to universal coverage.21
HOW WE CONDUCTED THIS SURVEY

The Commonwealth Fund 2023 Health Care Affordability Survey was conducted by SSRS from April 18 through July 31, 2023. The survey consisted of telephone and online interviews in English and Spanish and was conducted among a random, nationally representative sample of 7,873 adults age 19 and older living in the continental United States. A combination of address-based (ABS), SSRS Opinion Panel, and prepaid cell phone samples were used to reach people. In all, 4,417 interviews were conducted online or on the phone via ABS, 2,718 were conducted online via the SSRS Opinion Panel, and 738 were conducted on prepaid cell phones.

The sample was designed to generalize to the U.S. adult population and to allow separate analyses of responses from low-income households. Statistical results were weighted in stages to compensate for sample designs and patterns of nonresponse that might bias results. The first stage involved computing a base weight separately within each of the three sample sources to account for differential selection probabilities and response rates across sample strata, overlapping sample frames, and the sampling of one adult per household in the ABS. In the second stage, the demographic profile of the sample is calibrated to target population parameters. The data are weighted to the U.S. adult population by sex, age, education, geographic region, family size, race/ethnicity, population density, civic engagement, and frequency of internet use, using the 2022 U.S. Census Bureau’s Current Population Survey (CPS).

The resulting weighted sample is representative of the approximately 251 million U.S. adults age 19 and older. The survey has an overall maximum margin of sampling error of +/– 1.5 percentage points at the 95 percent confidence level. As estimates get further from 50 percent, the margin of sampling error decreases. The ABS portion of the survey achieved a 15 percent response rate, the SSRS Opinion Panel portion achieved a 2.8 percent response rate, and the prepaid cell portion achieved a 2.9 percent response rate.

This brief focuses on 6,121 adults in the survey under age 65. The resulting weighted sample is representative of approximately 194.9 million U.S. adults ages 19 to 64. The survey has a maximum margin of sampling error of +/– 1.7 percentage points at the 95 percent confidence level for this age group.

ACKNOWLEDGMENTS

The authors thank Robyn Rapoport, Elizabeth Sciupac, Hope Wilson, Rob Manley, and Jonathan Best of SSRS; Peter Lee of the Clinical Excellence Research Center at Stanford University; Sara Rosenbaum and MaryBeth Musumeci of George Washington University; and the Commonwealth Fund’s Joseph Betancourt, Melinda Abrams, Chris Hollander, Barry Scholl, Bethanne Fox, Neil Powe, Paul Frame, Jen Wilson, Arnav Shah, Munira Gunja, Evan Gumas, Gretchen Jacobson, Akeiisa Coleman, and Faith Leonard.

NOTES
  1. Consumer Financial Protection Bureau, Medical Debt Burden in the United States (CFPB, Feb. 2022).
  2. Maanasa Kona and Vrudhi Raimugia, State Protections Against Medical Debt: A Look at Policies Across the U.S. (Commonwealth Fund, Sept. 2023).
  3. Consumer Financial Protection Bureau, “CFPB Kicks Off Rulemaking to Remove Medical Bills from Credit Reports,” press release, Sept. 21, 2023; and White House, “Fact Sheet: The Biden Administration Announces New Actions to Lesson the Burden of Medical Debt and Increase Consumer Protection,” press release, Apr. 11, 2022.
  4. Chi Chi Wu, Jenifer Bosco, and April Kuehnhoff, Model Medical Debt Protection Act (National Consumer Law Center, Sept. 2019); and Christopher T. Robertson, Mark Rukavina, and Erin C. Fuse Brown, “New State Consumer Protections Against Medical Debt,” JAMA 327, no. 2 (Jan. 2022): 121–22.
  5. Richard M. Scheffler and Stephen M. Shortell, A Proposed Public Option Plan to Increase Competition and Lower Health Insurance Premiums in California (Commonwealth Fund, Apr. 2023); Christine H. Monahan, Justin Giovannelli, and Kevin Lucia, “HHS Approves Nation’s First Section 1332 Waiver for a Public Option Plan in Colorado,” To the Point (blog), Commonwealth Fund, July 13, 2022; Christine H. Monahan, Justin Giovannelli, and Kevin Lucia, “Update on State Public Option-Style Laws: Getting to More Affordable Coverage,” To the Point (blog), Commonwealth Fund, Mar. 29, 2022; Ann Hwang et al., State Strategies for Slowing Health Care Cost Growth in the Commercial Market (Commonwealth Fund, Feb. 2022); Choose Medicare Act, H.R. 5011, 117th Cong. (2021), H.R. Doc. 1–32; Medicare-X Choice Act of 2021, H.R. 1227, 117th Cong. (2021), H.R. Doc. 1–24; Medicare-X Choice Act of 2021, S. 386, 117th Cong. (2021), S. Doc. 1–25; State Public Option Act, H.R. 4974, 117th Cong. (2021), H.R. Doc. 1–27; State Public Option Act, S. 2639, 117th Cong. (2021), S. Doc. 1–27; Public Option Deficit Reduction Act, H.R. 2010, 117th Cong. (2021), H.R. Doc. 1–17; CHOICE Act, S. 983, 117th Cong. (2021), S. Doc. 1–12; Health Care Improvement Act of 2021, S. 352, 117th Cong. (2021), S. Doc. 1–75; and State-Based Universal Health Care Act of 2021, H.R. 3775, 117th Cong. (2021), H.R. Doc. 1–30.
  6. Henry J. Kaiser Family Foundation, “Section 13: Employer Practices, Telehealth, Provider Networks and Coverage for Mental Health Services,” 2022 Employer Health Benefits Survey (KFF, Oct. 27, 2022).
  7. Chris Koller, “Health Care Costs — Mapping the Forest and Finding a Path,” The View from Here (blog), Milbank Memorial Fund, Feb. 21, 2019.
  8. Sara R. Collins and Jennifer L. Nicholson, Rite of Passage: Young Adults and the Affordable Care Act of 2010 (Commonwealth Fund, May 2010).
  9. Elizabeth Y. McCuskey, Reforming ERISA to Help States Control Health Care Costs (Commonwealth Fund, Feb. 2023).
  10. Matthew Buettgens, Jessica Banthin, and Andrew Green, What If the American Rescue Plan Act Premium Tax Credits Expire? Coverage and Cost Projections for 2023 (Urban Institute, Apr. 2022).
  11. A bill introduced by Senator Jeanne Shaheen (D–N.H.) would raise the cost protection of the marketplace benchmark plan and make more people eligible for cost-sharing subsidies (Improving Health Insurance Affordability Act of 2021, S. 499, 117th Cong. (2021), S. Doc. 1–6). This could eliminate deductibles for some people and reduce them for others by as much as $1,650 a year. See Linda J. Blumberg et al., From Incremental to Comprehensive Health Insurance Reform: How Various Reform Options Compare on Coverage and Costs (Urban Institute, Oct. 2019); and Jesse C. Baumgartner, Munira Z. Gunja, and Sara R. Collins, The New Gold Standard: How Changing the Marketplace Coverage Benchmark Could Impact Affordability (Commonwealth Fund, Sept. 2022).
  12. John Holahan and Michael Simpson, Next Steps in Expanding Health Coverage and Affordability: What Policymakers Can Do Beyond the Inflation Reduction Act (Commonwealth Fund, Sept. 2022); Sara Rosenbaum, “Expanding Health Coverage to the Poorest Residents of States That Have Not Expanded Medicaid,” To the Point (blog), Commonwealth Fund, Feb. 1, 2022; and John Holahan et al., Filling the Gap in States That Have Not Expanded Medicaid Eligibility (Commonwealth Fund, June 2021, updated Oct. 5, 2021).
  13. Karen Pollitz, Justin Lo, and Rayna Wallace, Standardized Plans in the Health Care Marketplace: Changing Requirements (Henry J. Kaiser Family Foundation, May 2023).
  14. Karen Pollitz, Network Adequacy Standards and Enforcement (Henry J. Kaiser Family Foundation, Feb. 2022).
  15. Brigette Courtot et al., Section 1115 Waivers of Retroactive Medicaid Eligibility: Lack of Evidence Raises Flags and Warrants Caution (Urban Institute, July 2021).
  16. Sara Rosenbaum, “Demonstrations to Limit Retroactive Eligibility in Medicaid Lack Evidence and Threaten Access to Care,” To the Point (blog), Commonwealth Fund, Oct. 21, 2021.
  17. American Council on Aging, How Much Monthly Income Can Be Kept When Residing in a Medicaid-Funded Nursing Home? (ACOA, last updated June 20, 2023).
  18. Henry J. Kaiser Family Foundation, “Medicaid Eligibility Through the Medically Needy Pathway,” Timeframe: 2022.
  19. Sara R. Collins and Lauren A. Haynes, “Congress Can Give States the Option to Keep Adults Covered in Medicaid,” To the Point (blog), Commonwealth Fund, Nov. 14, 2022.
  20. Rosenbaum, “Expanding Health Coverage,” 2022.
  21. The approach would treat all legal residents as insured 12 months a year regardless of whether they actively enrolled in a health plan. Income related premiums would be collected through the tax system. See Linda J. Blumberg, John Holahan, and Jason Levitis, How Auto-Enrollment Can Achieve Near-Universal Coverage: Policy and Implementation Issues (Commonwealth Fund, June 2021).

Publication Details

Date

Contact

Sara R. Collins, Senior Scholar, Vice President, Health Care Coverage and Access & Tracking Health System Performance, The Commonwealth Fund

[email protected]

Citation

Sara R. Collins, Shreya Roy, and Relebohile Masitha, Paying for It: How Health Care Costs and Medical Debt Are Making Americans Sicker and Poorer — Findings from the Commonwealth Fund 2023 Health Care Affordability Survey (Commonwealth Fund, Oct. 2023). https://doi.org/10.26099/bf08-3735