Advanced Search

Advanced Search

Current Filters

Filter your query

Publication Types

Other

to

Toplines
  • States that entered the COVID-19 pandemic with stronger health systems had lower rates of preventable deaths and healthier populations

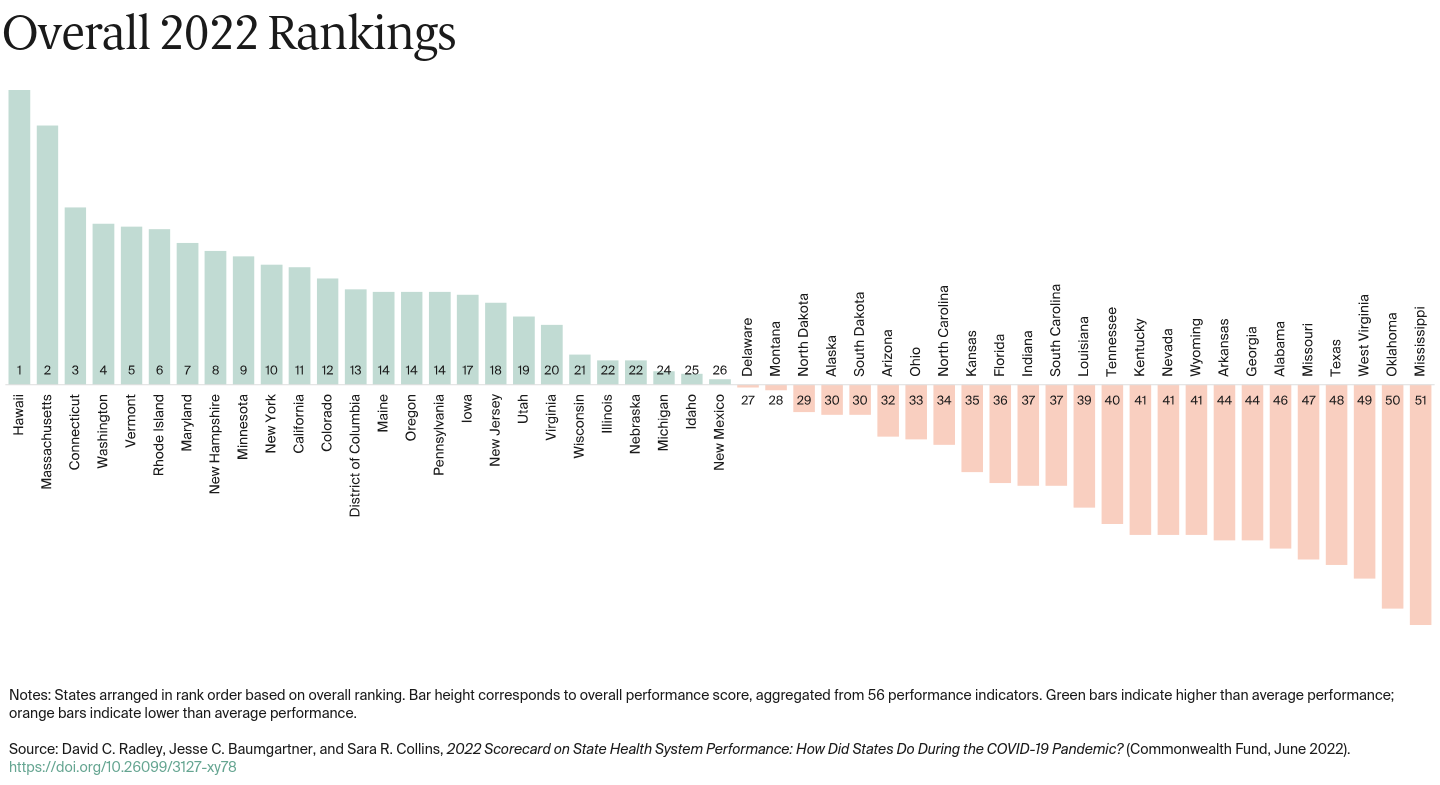
  • Hawaii and Massachusetts top the Commonwealth Fund’s 2022 Scorecard on State Health System Performance, based on measures that include health outcomes during COVID-19 in 2020; the lowest-performing states were Mississippi, Oklahoma, and West Virginia

Highlights

  • COVID-19 took a huge toll on Americans’ health, directly and indirectly, but that toll varied dramatically by state.
  • Hawaii and Massachusetts top the 2022 State Scorecard rankings, based on overall performance across 56 measures of health care access and quality, service use and cost, health disparities, and health outcomes during the COVID-19 pandemic in 2020. The lowest-performing states were Mississippi, Oklahoma, and West Virginia.
  • The pandemic’s impact reverberated throughout the health system in every state, as health care use fell and deaths from drug overdoses and treatable causes rose.
  • Federal pandemic relief policies helped stabilize insurance coverage.
  • Opportunities exist to strengthen states’ insurance coverage and care delivery systems so they are better able to withstand future health emergencies.

Introduction

Every year, the Commonwealth Fund’s Scorecard on State Health System Performance uses the latest data available to assess how well the health care system is working in every state. We ask such questions as:

  • Do Americans have good access to health care? Does their health insurance enable them to get the care they need to stay healthy? Are they protected from high out-of-pocket health costs?
  • Are Americans getting the right health care, at the right time, and in the right setting? To what extent are they seeking care from emergency departments or other costly settings instead of visiting a primary care provider? Has health care use and spending gone up or down?
  • How healthy is America? How prevalent are high-risk behaviors like smoking or health conditions like obesity that put people at higher risk for poor health? What are Americans’ chances of dying early in life from preventable or treatable causes?

For the 2022 State Scorecard, we added a new area of inquiry:

  • How well has each state responded to and managed the COVID-19 pandemic? With data that generally reflect the nation’s experience since 2020, we were able to provide a window on how state health systems have performed as the pandemic was unfolding.

To be sure, COVID-19 has challenged the health care system in all states. Still, many states have been able to maintain a high level of performance in the face of crisis. Looking across all measures of performance — health care access, quality, and spending, as well as health outcomes and equity — we find that Hawaii and Massachusetts top this year’s rankings. These two states’ overall performance separates them from other states, even other top performers. Both were consistently among the top three states across each of the seven dimensions of performance the State Scorecard evaluates.

Connecticut, Washington, and Vermont rounded out the five top-performing states. Mississippi, Oklahoma, and West Virginia ranked lowest overall.

We found that states that have historically performed well on our State Scorecard also performed well as the pandemic unfolded, both on our usual set of health system measures and the new COVID-19-specific measures.

2022-scorecard-on-state-health-system-performance-overall-2022-rankings

How COVID-19 Impacted State Health Care Systems

COVID-19 placed considerable stress on health care in every state. However, states experienced, and responded to, the pandemic differently, as shown by measures in key areas of performance: vaccination rates; hospital and intensive care unit (ICU) capacity; and what is known as “excess mortality,” or death rates that exceed historical norms for a given time and place.

All states have made progress in vaccinating their residents against COVID-19, but there are ample opportunities for improvement.

COVID-19 vaccines are effective at decreasing transmission of the SARS-CoV-2 virus and reducing hospitalizations and deaths among those infected. They are a crucial public health tool for combatting the pandemic.

The first vaccine became available to all states at the same time in late 2020. States took different approaches to distributing doses to people, especially early on when vaccine supplies were limited.1 In the states that moved the fastest to get shots in arms — Vermont, Massachusetts, Connecticut, and Maine — 70 percent of the population age 12 and older had completed a full vaccine series (typically, two doses) within 200 days from when the vaccine became available. In contrast, 21 states still had not reached 70 percent by the end of March 2022 (see Appendix Table G1), and Alabama, Wyoming, and Mississippi had yet to reach 60 percent (data not shown).

With new COVID variants continuing to emerge, the Centers for Disease Control and Prevention (CDC) has also recommended booster shots for most individuals. Despite the renewed protection they offer, less than 40 percent of all U.S. adults age 18 and older had received a single booster dose, in addition to their initial vaccination series, by the end of March 2022 (see Appendix Table G1). This ranged from more than 50 percent of adults in Vermont, Rhode Island, and Maine to less than 25 percent in North Carolina, Alabama, and Mississippi.

COVID-19 pushed hospitals to the breaking point, as many operated close to capacity while being understaffed.

Millions of Americans across all states have become severely ill with COVID-19. With 4.6 million COVID-related hospitalizations from August 2020 through March 2022 — often for patients requiring intensive care — many hospitals were overwhelmed.2 The State Scorecard measured the total number of days during the pandemic on which at least 80 percent of ICU beds in each state were occupied. More days at high ICU capacity suggests stress on the care delivery system, a reduced ability to respond when COVID cases surge, and less capacity to treat patients hospitalized with non-COVID illnesses.

Between August 2020 and March 2022, 16 states and the District of Columbia operated at high ICU capacity for at least 150 days. Texas and Alabama stand out, with 566 and 517 days at or above 80 percent ICU capacity, respectively. Rhode Island, Georgia, Mississippi, New Mexico, and Oklahoma also exceeded 300 days (see Appendix Table G1).

2022-scorecard-on-state-health-system-performance-covid-19-icu-capacity

Many hospitals operating near capacity were doing so while short-staffed, in part because hospital workers who contracted COVID needed to isolate. Between August 2020 and March 2022, 18 states experienced at least 100 days in which a significant share (25%) of their hospitals reported critical staffing shortages. Alabama had 516 days of reported critical staffing shortages; South Carolina, New Mexico, and Rhode Island each experienced more than 400 days (see Appendix Table G1).

The death toll from COVID is high and extends beyond deaths directly attributed to the virus.

By the spring of 2022, over 1 million Americans had died of COVID-19.3 But the virus’s effect on health outcomes has extended well beyond deaths directly attributable to COVID. Because the pandemic disrupted their ability to get timely care for conditions other than COVID-19, many more people likely died sooner than they otherwise would have.

2022-scorecard-on-state-health-system-performance-covid-19-excess-deaths

Every state has experienced higher-than-expected mortality from all causes — deaths from COVID-19 in addition to deaths from other causes, like heart disease, cancer, and drug overdose — since the pandemic began. The number of excess deaths varies fivefold across states, from 110 per 100,000 people in Hawaii to 596 per 100,000 in Mississippi.

While COVID has been the driving force behind high rates of excess deaths across the U.S., states with historically strong health systems — low uninsured rates, robust primary care capacity, and effective care management — generally had lower rates than states with weaker health systems. Hawaii, New Hampshire, and Washington recorded the lowest excess death rates, fewer than 200 deaths per 100,000 people. Mississippi, West Virginia, and Alabama had more than 500 deaths per 100,000.

Amid the pandemic’s disruptions, deaths from preventable causes such as drug overdoses and chronic conditions rose across the country.

As the coronavirus quickly spread, Americans suddenly had to navigate disruptions in their access to health care facilities and cope with prolonged periods of isolation and economic uncertainty. Premature deaths from preventable causes like drug overdoses, alcohol use, diabetes, and pregnancy rose alongside COVID deaths. The pandemic’s broad impact on population health will likely be felt for years to come.

Deaths related to substance use spiked after the arrival of COVID-19.

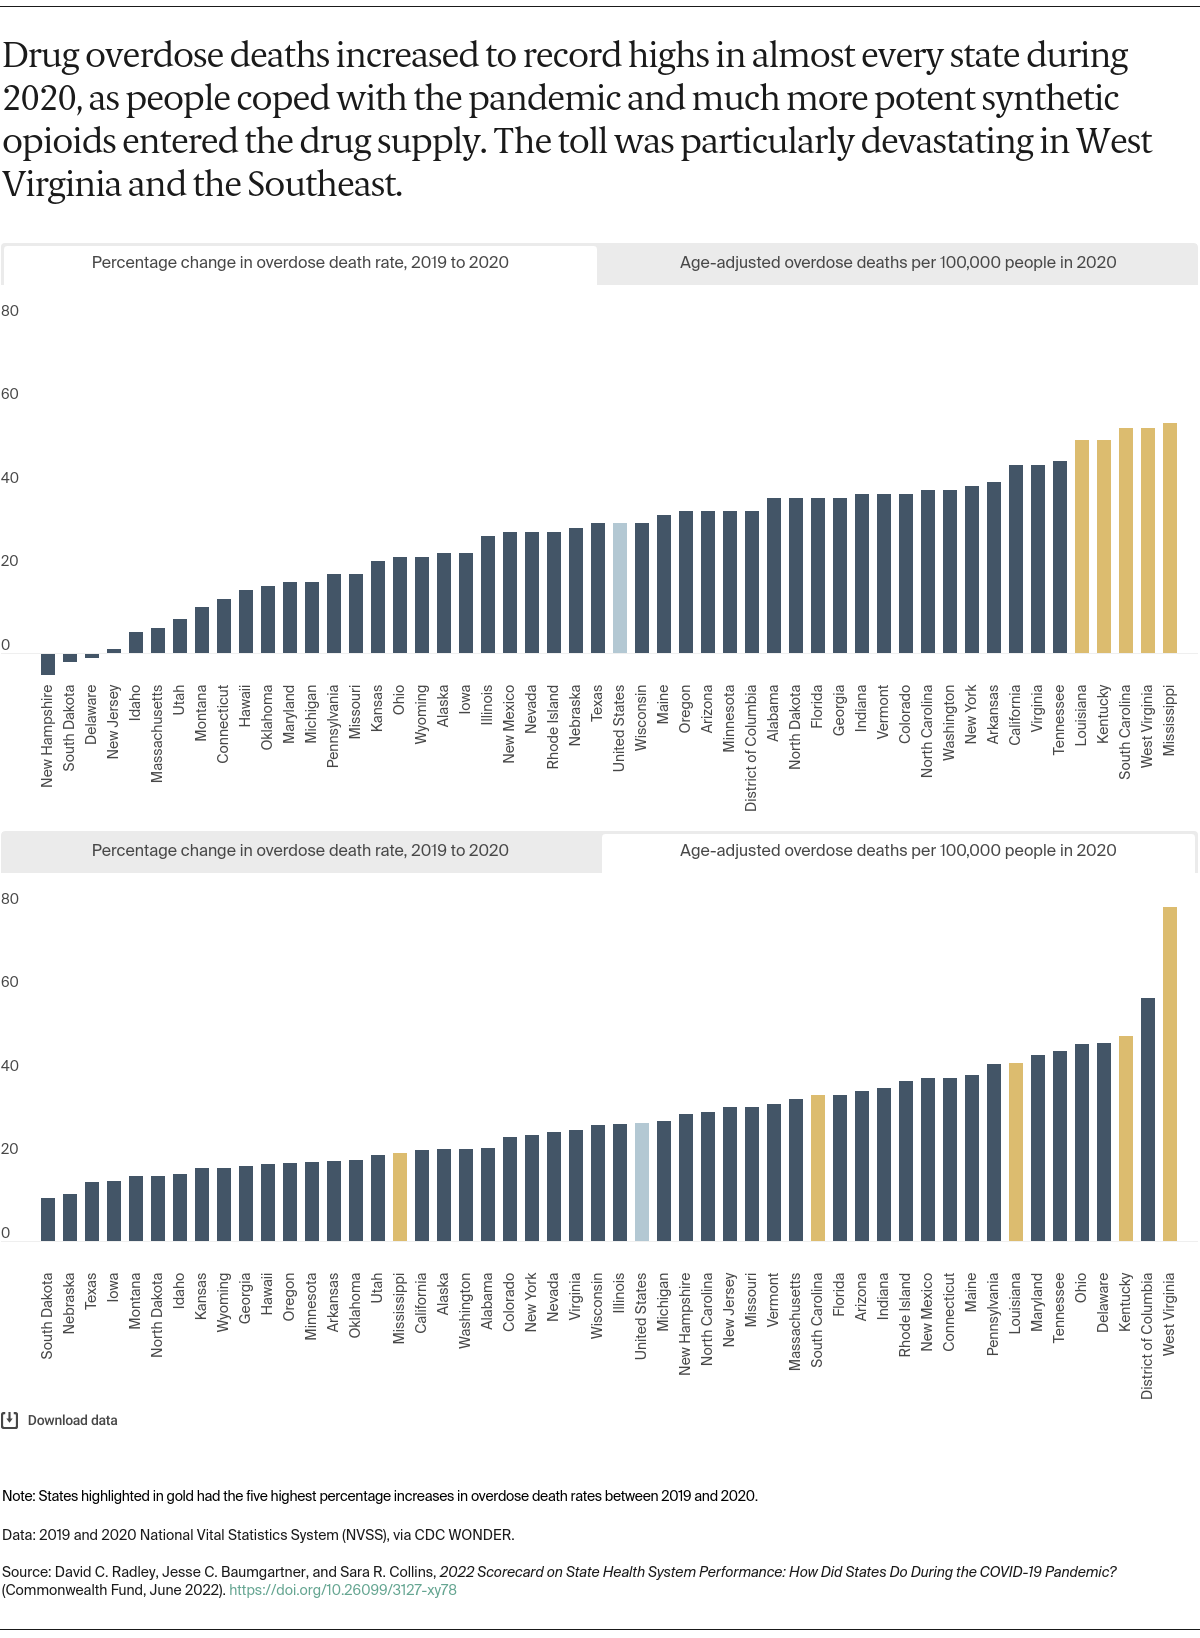
Drug overdoses are a public health crisis. After rising steadily through 2017, drug overdose deaths had leveled off by 2018–19. However, immediately after the pandemic began, deaths spiked, as people dealt with physical isolation, disrupted addiction treatment, and a supply of deadlier drugs like fentanyl.4 Overdoses claimed a record 91,799 lives in 2020, with rates increasing at least 20 percent in 35 states and the District of Columbia.

2022-scorecard-on-state-health-system-performance-outcomes-overdose-deaths

Previously hard-hit areas like West Virginia reported the greatest absolute increases in rates of overdose mortality in 2020. But many southern states, including Florida, South Carolina, Louisiana, and Tennessee, also endured large jumps in mortality. Provisional data now show that 2021 was even deadlier, with more than 105,000 overdose deaths projected and large increases in nearly every region.5

Deaths attributable to alcohol, which has been consumed at higher rates during the pandemic, also jumped right after COVID-19’s arrival.6 Alcohol-related mortality rose by an unprecedented 26 percent in 2020, to more than 49,000 total deaths (10,000 deaths higher than in 2019), with higher rates and increases in many parts of the western and Great Plains regions (see Appendix Table F1). New Mexico, Wyoming, and Alaska reported the highest age-adjusted mortality rates, all exceeding 32 deaths per 100,000 people.

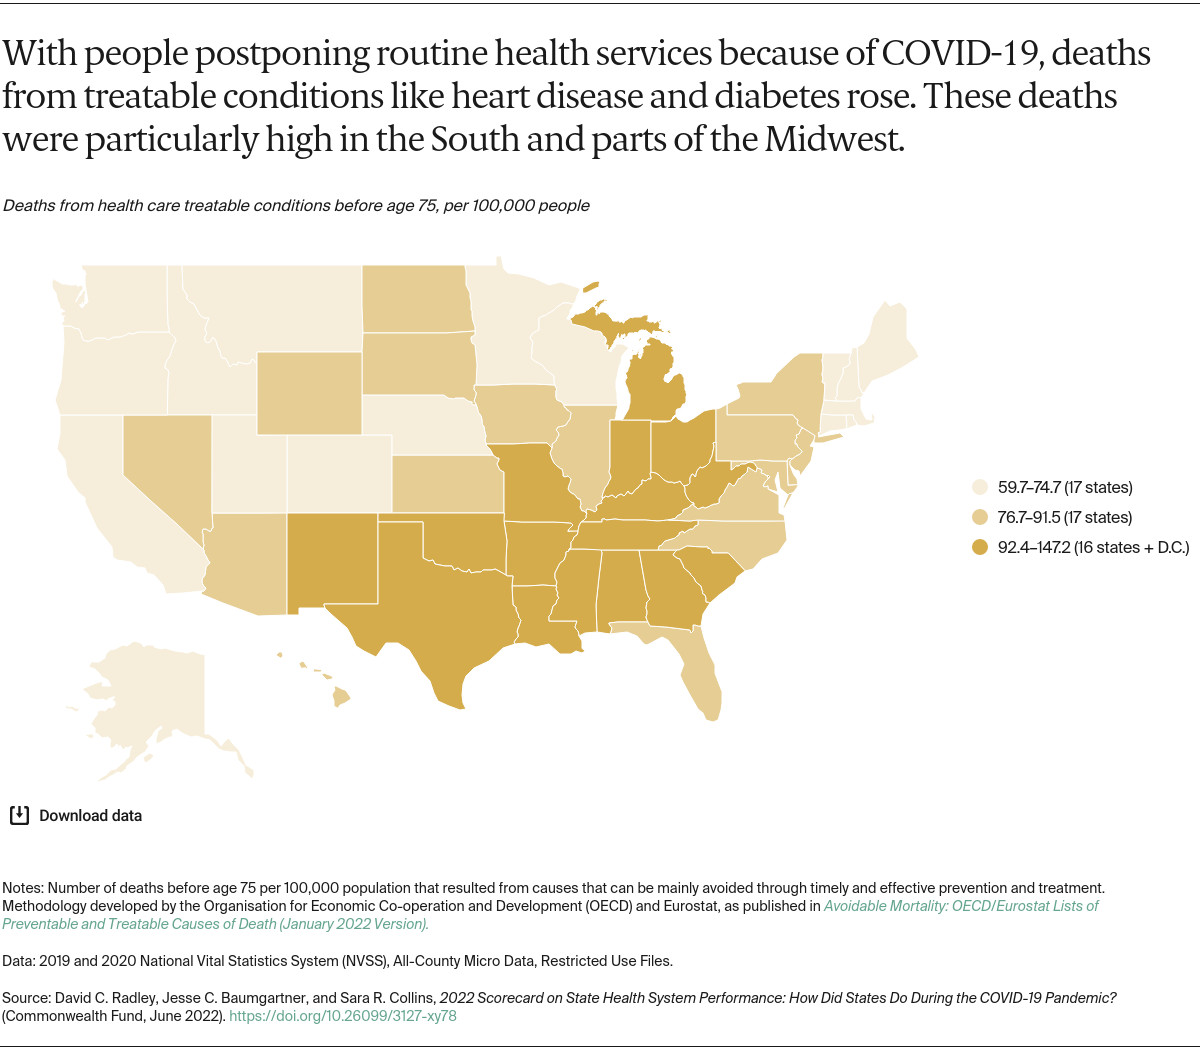
Premature deaths from treatable causes grew at unprecedented rates in 2020.

As evidenced by steep declines in outpatient visits during 2020,7 many Americans were forced to delay routine health services such as checkups, screenings, and chronic care management because of COVID-19 lockdowns and overwhelmed health care facilities. Premature deaths from treatable conditions such as heart disease and diabetes, which can be managed through timely, high-quality care, jumped from 83.8 to 89.8 deaths per 100,000 population between 2019 and 2020.8 This measure had stayed nearly constant in the eight years leading up the pandemic. Particularly in the South and Midwest, preventable deaths remain elevated (see Appendix Table F1).

2022-scorecard-on-state-health-system-performance-outcomes-preventable-deaths

Another category of preventable deaths, maternal mortality, also increased in 2020, with the highest rates in southern states (see Appendix Table F1).9

Black, Indigenous, and Latinx/Hispanic people — groups that have been among the most affected by COVID-19 — experienced the most significant preventable mortality increases.10

Health Insurance Coverage Held Steady During 2020, But Losses Loom on the Horizon

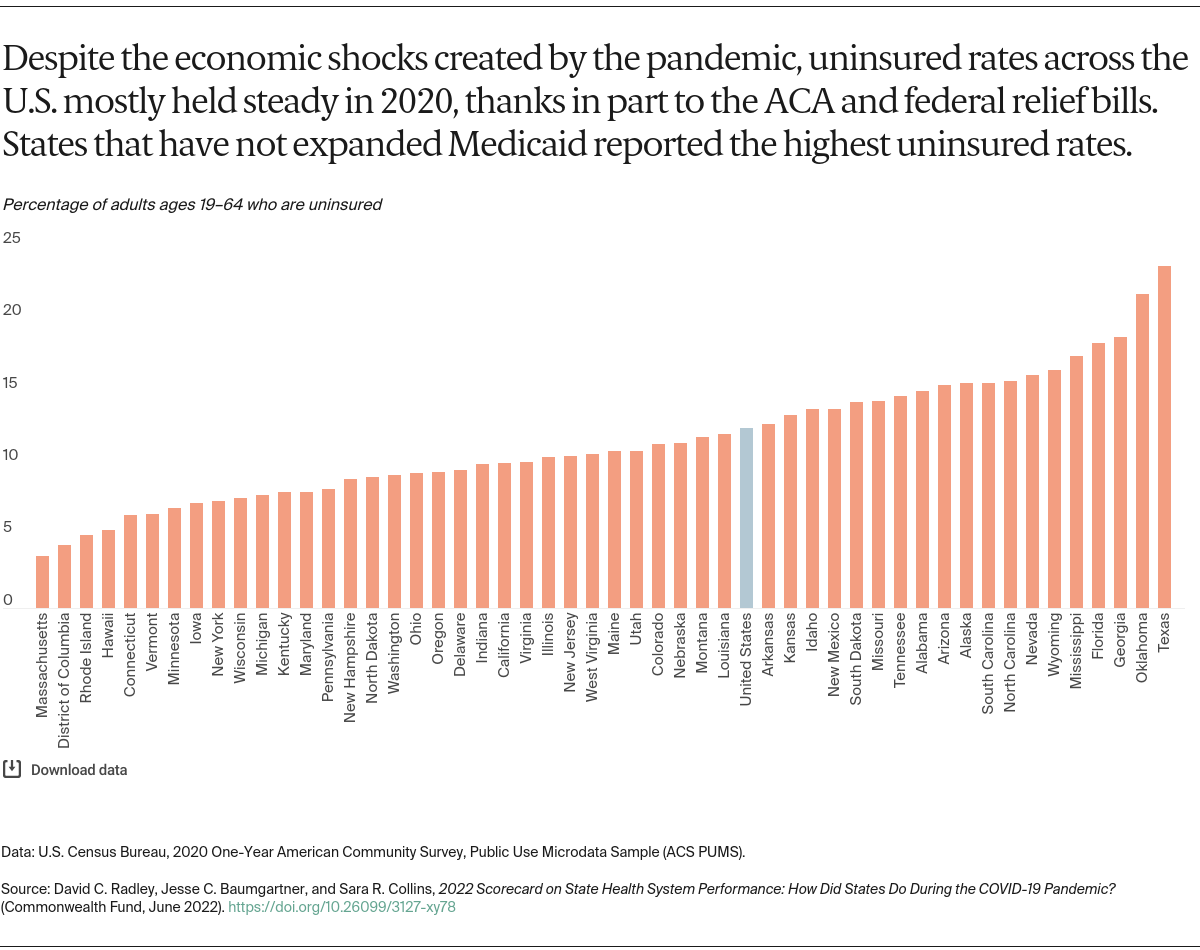
Despite expectations that loss of employment, and employer-provided health benefits, during the pandemic would leave millions of people uninsured, the national uninsured rate held steady in 2020. More recent federal data show an actual decline in early 2021. But risks to people’s coverage and their ability to afford health care remain.     

The stability in insurance coverage in 2020 stemmed from three factors:11

  • lower-than-expected declines in employer insurance coverage, as job losses were concentrated in industries that are less likely to offer coverage to workers
  • the insurance coverage expansions of the Affordable Care Act (ACA), which provided safety-net coverage for people who lost their insurance
  • the Families First Coronavirus Response Act, a 2020 law that required states to keep people continuously enrolled in Medicaid in exchange for enhanced federal matching funds through the end of the federally declared public health emergency.

In 2021, the American Rescue Plan, as well as actions taken by the Biden administration, raised subsidies for marketplace plan premiums and made it easier for people to enroll in plans.

2022-scorecard-on-state-health-system-performance-access-uninsured-rates

Most states with high uninsured rates in 2020 were those that had not expanded Medicaid eligibility, as the ACA allows. Lower-income residents of these states who lost their employer coverage thus lacked a critical fallback option that was available to residents of states that did expand Medicaid.

Still, the recent improvements in coverage may prove ephemeral. The temporary “continuous eligibility” requirement in Medicaid will end once the federal public health emergency is over. This will trigger a massive effort to redetermine people’s eligibility for Medicaid in all 50 states and the District of Columbia.12 When all is said and done, as many as 15.8 million people could be disenrolled from Medicaid, and some will not be able to find other coverage.13

Moreover, the American Rescue Plan’s enhanced subsidies for marketplace plan coverage are set to expire at the end of 2022. If Congress does not extend these subsidies, the number of uninsured people could climb by 3 million.14 These potential coverage losses will coincide with the cessation of federal funds that have until now paid for COVID-19 testing, treatment, and vaccines for people without insurance.

While health coverage held steady, use of health services declined.

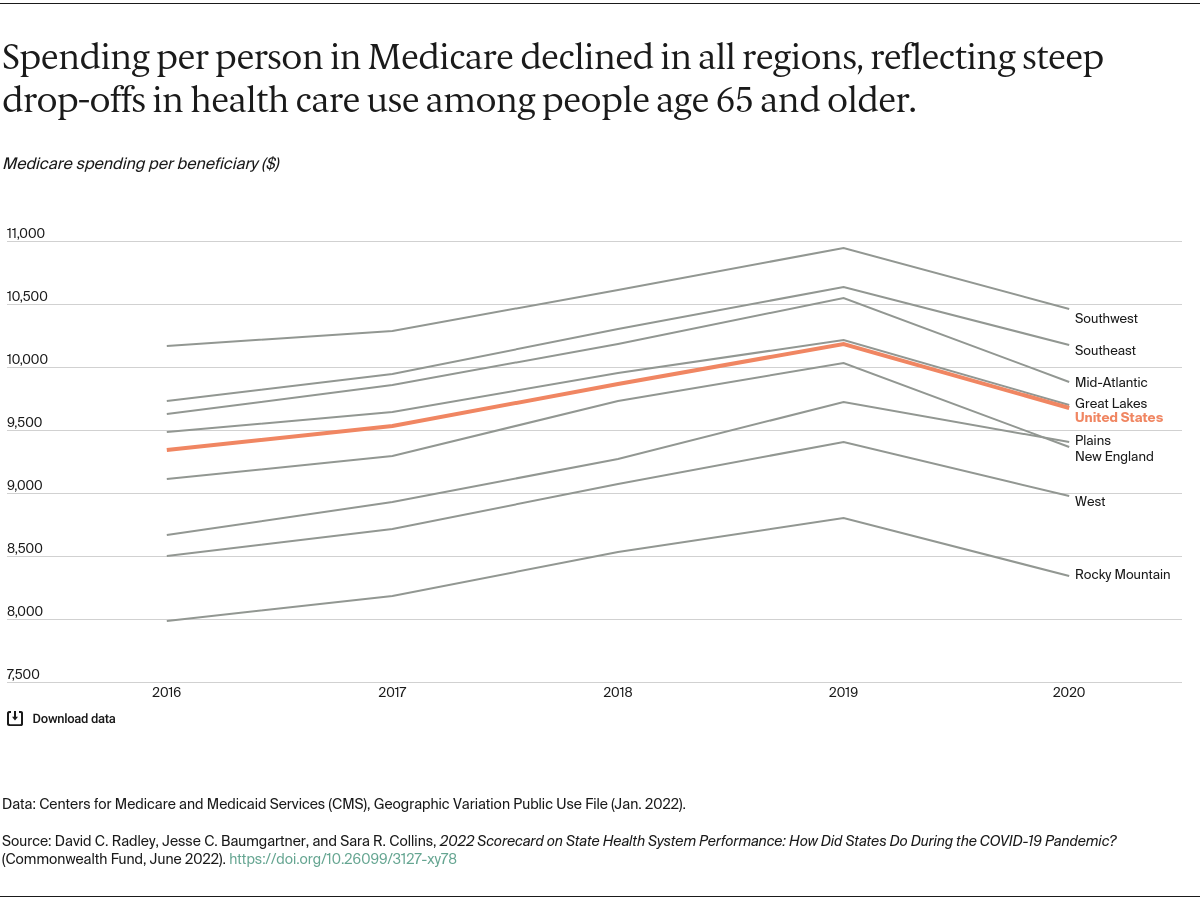
For people who fell ill with COVID, this stability in insurance coverage, along with federal funding of COVID-19 testing and treatment for the uninsured, was critical to ensuring timely access to care. It also ensured that the providers who cared for them would be paid. But there were massive declines in use of health care services unrelated to COVID treatment during 2020, as evidenced by several measures of access and health care use in the State Scorecard. For example, reports of cost-related access problems declined in nearly every state (see Appendix Table C2). Similarly, the share of people with high out-of-pocket costs relative to income also fell nationally between 2016–17 and 2019–20, with declines of 3 percentage points or more in Alabama, Arizona, Arkansas, Connecticut, Indiana, and Missouri (data not shown). And despite the fact that people age 65 and older were the hardest-hit age group in terms of contracting serious illness from COVID-19, Medicare spending per beneficiary declined in all regions of the country in 2020.

2022-scorecard-on-state-health-system-performance-access-medicare-spending

Policy Changes That Could Make a Difference

The COVID-19 pandemic, as well as state and federal responses to it, has had a profound impact on people’s health and on health care systems in every state. What are some of the ways that we could apply lessons learned from the past two years to improve the overall performance of U.S. health care in the years ahead?

Strengthening States’ Ability to Respond to Future Crises

The COVID-19 pandemic caught too many of us off guard. Public health funding cuts in 2018 only hampered federal and state responses in the early months of the pandemic.15 But there are actions we as a nation could take to strengthen our ability to prepare for the public health crises that are sure to come.

  • Develop a long-term, evidence-based pandemic preparedness strategy, drawing on recent lessons learned, that delineates federal and state responsibilities and authorities. Build public trust in the plan through early education and outreach efforts.16
  • Fight misinformation and its spread — particularly on social media — by strengthening content moderation policies related to matters of public health.17
  • Require hospitals and other health facilities to develop a comprehensive disaster response strategy featuring detailed plans for reallocating resources to increase short-term capacity and for bringing on and training the additional staff that may be needed.18

Reducing Deaths from Preventable Causes

To reverse the continued rise in deaths from substance use and treatable health conditions, it will be important to prioritize policy solutions that center equity, safety, and health.

Addressing the overdose crisis:

  • Increase access to effective addiction treatments by lowering insurance and administrative barriers and requiring treatment availability throughout the criminal justice system.19
  • Increase investment in harm reduction by expanding availability of overdose reversal drugs and drug-testing services and establishing supervised consumption sites.

Lowering deaths from treatable conditions:

  • Boost investment in good primary care — the foundation for a high-performing health care system — and fully integrate behavioral health services with primary care services.20
  • Lower financial barriers to care that are preventing many people from getting appropriate treatment for chronic conditions like diabetes.21
  • Target maternal mortality, including the stark racial disparities associated with it, by growing and diversifying the perinatal workforce, funding community-based maternal care models, expanding telehealth services, promoting high-value payment models, and improving data collection efforts.22
  • Invest broadly in social services to address factors that are key determinants of health and well-being, such as housing and economic security.23

Continuing to Make Coverage More Affordable and Care More Accessible

Four near-term solutions could help the nation maintain progress on health coverage and give uninsured Americans access to COVID-19 prevention and treatment:

  • Make the American Rescue Plan’s marketplace premium subsidy enhancements permanent.
  • Require states to conduct Medicaid eligibility redeterminations gradually and phase down — rather than immediately eliminate — the temporary increase in Medicaid matching funds that is set to expire once the public health emergency ends.
  • Replenish federal funds for COVID-19 testing, treatment, and vaccination of uninsured people.
  • Provide a federal fallback option for people with low income who live in states that have yet to expand eligibility for their Medicaid program.24

Longer term, we can apply lessons from the pandemic by fully deploying, and building on, the ACA to get more people covered. Lawmakers could:

  • Make it easier for adults to maintain their Medicaid eligibility by giving states the option to make eligibility continuous, without the need to apply for a federal waiver — much like we currently do for children in Medicaid and the Children’s Health Insurance Program.25
  • Maintain vigorous, targeted, and consistent outreach and enrollment efforts to cover people who remain uninsured and keep them covered.
  • Enable people to autoenroll in the coverage for which they are eligible.26
2022-scorecard-on-state-health-system-performance-overall-rankings-table
SCORECARD METHODS

The Commonwealth Fund’s 2022 Scorecard on State Health System Performance evaluates states on 56 performance indicators grouped into five dimensions, including a new dimension focused on how well states responded to and managed the COVID-19 pandemic.

The report generally reflects data from 2020. The seven new measures related to efforts to combat COVID-19 incorporate data through the first quarter of 2022.

Access and Affordability (8 indicators): includes rates of insurance coverage for children and adults, as well as individuals’ out-of-pocket expenses for health insurance and medical care, cost-related barriers to receiving care, rates of medical debt, and receipt of dental visits.

Prevention and Treatment (14 indicators): includes measures of receipt of preventive care and needed mental health care, as well as measures of quality in ambulatory, hospital, postacute, and long-term care settings.

Avoidable Hospital Use and Cost (14 indicators; including several measures reported separately for distinct age groups): includes indicators of hospital and emergency department use that might be reduced with timely and effective care and follow-up care, estimates of per-person spending among Medicare beneficiaries and working-age adults with employer-sponsored insurance, and the share of Medicare and employer-sponsored insurance spending directed toward primary care.

Healthy Lives (13 indicators): includes measures of premature death, health status, health risk behaviors and factors (including smoking and obesity), tooth loss, and state public health funding.

COVID-19 (7 indicators): includes measures to reflect state progress in vaccinating residents, COVID-related hospitalization rates and health system stress, and COVID-related mortality through the end of March 2022.

For several measures in our COVID-19 domain (high ICU stress, hospital staffing shortages, hospitalizations, nursing home deaths), data did not become consistently available, across all states, until May–August 2020, depending on the data source. This means that information from the earliest months of the pandemic may not be fully reflected in our assessment of state COVID-19 performance. This may have a larger impact on states like New York, where the pandemic first emerged in early 2020.

INCOME DISPARITY DIMENSION

This year, the State Scorecard reports on performance differences within states associated with individuals’ income level for 13 of the 56 indicators where data are available to support a population analysis by income; these indicators span three of the five dimensions. For each indicator, we measure the difference between rates for a state’s low-income population (generally less than 200% of the federal poverty level) and higher-income population (generally more than 400% of the federal poverty level). States are ranked on the magnitude of the resulting disparities in performance.

The income disparity indicators are different than those used in previous scorecards; hence, these disparity rankings are not strictly comparable to those published previously. For some indicators, we combined multiple years of data to ensure adequate sample sizes for stratified analysis.

RACIAL AND ETHNIC HEALTH EQUITY DIMENSION

This year, the State Scorecard ranks states based on racial and ethnic health equity. To do this, we incorporated summary state health system performance scores for each of four racial and ethnic groups, pulled directly from our November 2021 report, Achieving Racial and Ethnic Equity in U.S. Health Care: A Scorecard of State Performance.

That report aggregated data on 24 performance indicators (reflecting health outcomes, health care access, and health care quality), stratified by race and ethnicity for Black, white, Latinx/Hispanic, American Indian/Alaska Native (AIAN), and Asian American, Native Hawaiian, and Pacific Islander (AANHPI) populations.

Each population group in each state received a percentile score from 1 (worst) to 100 (best) reflecting the state’s overall health system performance for that group. This enabled comparisons within and across states. For example, a state health system score of 50 for Latinx/Hispanic people in California indicates that the health system is performing better for those residents than Latinx/Hispanic people in Florida, who have a score of 38, but worse than for white residents in California, who have a score of 89.

The overall percentile scores from that report for AIAN, AANHPI, Black, and Latinx/Hispanic people were used in this year’s State Scorecard to reflect each state’s performance for nonwhite racial and ethnic groups. States were evaluated and ranked on their health system performance for each of the four groups separately (contingent on data availability), and those scores were then combined for the state’s final overall equity composite score. Summary scores for each group can be found in Appendix I1. State health system performance scores for white residents are included in the appendix for comparative purposes.

We also include performance data for each of the 24 metrics used in that equity report — updated to the most current year — in each state’s 2022 scorecard profile.

GUIDING PRINCIPLES

The following principles guided the development of the State Scorecard:

Performance Metrics. The 56 metrics selected for this report span health care system performance, representing important dimensions and measurable aspects of care and response to the COVID-19 pandemic. Where possible, indicators align with those used in previous scorecards. Several indicators used in previous versions of the State Scorecard have been dropped either because all states improved to the point where no meaningful variations existed (for example, measures that assessed hospitals on processes of care) or the data to construct the measures were no longer available (for example, hospitalizations for children with asthma). New indicators have been added to the State Scorecard series over time in response to evolving priorities or data availability (e.g., measures of maternal mortality and medical debt).

Measuring Change over Time. We were able to track performance over time for 45 of the 56 indicators. Not all indicators could be trended because of changes in the underlying data or measure definitions, and some reflect newly collected data (e.g., COVID-19-specific measures).

For indicators where trends were possible, there were generally five years between indicators’ baseline and current-year data observation, though the starting and ending points depended on data availability (see Appendix A1).

We considered a change in an indicator’s value between the baseline and current-year data points to be meaningful if it was at least one-half (0.5) of a standard deviation larger than the indicator’s combined distribution over the two time points — a common approach used in social science research. We did not formally evaluate change over time for indicators in the income dimension.

Data Sources. Indicators generally draw from publicly available data sources, including government-sponsored surveys, registries, publicly reported quality indicators, vital statistics, mortality data, and administrative databases. The most current data available were used in this report whenever possible. Appendix A1 provides detail on the data sources and time frames.

Scoring and Ranking Methodology. For each indicator, a state’s standardized z-score is calculated by subtracting the 51-state average (including the District of Columbia as if it were a state) from the state’s observed rate, and then dividing by the standard deviation of all observed state rates. States’ standardized z-scores are averaged across all indicators within the performance dimension, and dimension scores are averaged into an overall score. Ranks are assigned based on the overall score. This approach gives each dimension equal weight and, within each dimension, it weights all indicators equally. This method accommodates the different scales used across State Scorecard indicators (for example, percentages, dollars, and population-based rates).

As in previous scorecards, if historical data were not available for a particular indicator in the baseline period, the current-year data point was used as a substitute, thus ensuring that ranks in each time period were based on the same number of indicators.

REGIONAL COMPARISONS

The State Scorecard groups states into the eight regions used by the Bureau of Economic Analysis to measure and compare economic activity. The regions are: Great Lakes (Illinois, Indiana, Michigan, Ohio, Wisconsin); Mid-Atlantic (Delaware, District of Columbia, Maryland, New Jersey, New York, Pennsylvania); New England (Connecticut, Maine, Massachusetts, New Hampshire, Rhode Island, Vermont); Plains (Iowa, Kansas, Minnesota, Missouri, Nebraska, North Dakota, South Dakota); Rocky Mountain (Colorado, Idaho, Montana, Utah, Wyoming); Southeast (Alabama, Arkansas, Florida, Georgia, Kentucky, Louisiana, Mississippi, North Carolina, South Carolina, Tennessee, Virginia, West Virginia); Southwest (Arizona, New Mexico, Oklahoma, Texas); and West (Alaska, California, Hawaii, Nevada, Oregon, Washington).
ACKNOWLEDGMENTS

We owe our sincere appreciation to all of the researchers who developed indicators and conducted data analyses for this scorecard. These include: Michael E. Chernew and Andrew Hicks, Department of Health Care Policy, Harvard Medical School; Sherry Glied and Mikaela Springsteen, New York University Robert F. Wagner Graduate School of Public Service; Vincent Mor and Emily Gadbois, Brown University; and Angelina Lee and Kevin Neipp, Westat. We acknowledge Mental Health America for data reported in The State of Mental Health in America; Trust for America’s Health for data reported in The Impact of Chronic Underfunding on America’s Public Health System: Trends, Risks, and Recommendations, 2020; and the Urban Institute for data reported in Debt in America.

We would like to thank the following current and former Commonwealth Fund staff members: David Blumenthal, Melinda Abrams, Rachel Nuzum, and Eric Schneider for providing constructive feedback and guidance; and the Fund’s communications and support teams, including Barry Scholl, Chris Hollander, Deborah Lorber, Bethanne Fox, Josh Tallman, Jen Wilson, Paul Frame, Naomi Leibowitz, Elisa Mirkil, Sam Chase, Relebohile Masitha, Arnav Shah, Noël Manu, Evan Gumas, Alexandra Bryan, Sara Federman, Lauren Haynes, and Celli Horstman for their guidance, editorial and production support, and public dissemination efforts.

Finally, the authors wish to acknowledge Maya Brod of Burness Communications for her assistance with media outreach, and Westat for its support of the research unit, which enabled the analysis and development of the scorecard report.

NOTES
  1. National Academy for State Health Policy, “State Plans for Vaccinating Their Populations Against COVID-19,” updated Apr. 19, 2021.
  2. Total COVID-related hospitalization estimate from August 2020 through March 2022 (4.6 million) from: Centers for Disease Control and Prevention, “COVID Data Tracker,” U.S. Department of Health and Human Services, accessed Apr. 18, 2022. COVID-19 hospitalizations were not systematically tracked prior to August 2020.
  3. Centers for Disease Control and Prevention, “COVID Data Tracker,” U.S. Department of Health and Human Services, accessed Apr. 18, 2022.
  4. Jesse C. Baumgartner and David C. Radley, “Overdose Deaths Surged in the First Half of 2021, Underscoring Urgent Need for Action,” To the Point (blog), Commonwealth Fund, Feb. 7, 2022.
  5. National Vital Statistics System (NVSS), “Provisional Drug Overdose Death Counts,” Centers for Disease Control and Prevention, accessed May 15, 2022.
  6. Aaron M. White et al., “Alcohol-Related Deaths During the COVID-19 Pandemic,” JAMA 327, no. 17 (Mar. 2022): 1704–6; and Michael S. Pollard, Joan S. Tucker, and Harold D. Green Jr., “Changes in Adult Alcohol Use and Consequences During the COVID-19 Pandemic in the U.S.,” JAMA Network Open 3, no. 9 (Sept. 29, 2020): e2022942.
  7. Ateev Mehrotra et al., The Impact of COVID-19 on Outpatient Visits in 2020: Visits Remained Stable, Despite a Late Surge in Cases (Commonwealth Fund, Feb. 2021).
  8. In order to produce state-level estimates, the State Scorecard uses two data years combined (2019 and 2020) for the treatable and preventable mortality measures. Here in the report text, we use national single-year estimates to show the significant, unprecedented change in treatable mortality during the first year of the pandemic (2020). A similar directional change is seen using two-year national estimates (86.3 deaths per 100,000 people in 2019–20 compared to 83.8 per 100,000 in 2018–19). Chad Terhune and Robin Respaut, “U.S. Diabetes Deaths Top 100,000 for Second Straight Year,” Reuters, Jan. 31, 2022; Stephen Sidney et al., “Age-Adjusted Mortality Rates and Age and Risk-Associated Contributions to Change in Heart Disease and Stroke Mortality, 2011–2019 and 2019–2020,” JAMA Network Open 5, no. 3 (Mar. 23, 2022): e223872; and authors’ analysis of Centers for Disease Control and Prevention, National Vital Statistics System (NVSS), Wide-Ranging Online Data for Epidemiologic Research (WONDER).
  9. Donna L. Hoyert, Maternal Mortality Rates in the United States, 2020 (CDC National Center for Health Statistics, Feb. 2022); Maternal Mortality per 100,000 Live Births, Commonwealth Fund Health System Data Center.
  10. Authors’ calculations using 2018–20 National Vital Statistics System (NVSS), All-County Micro Data, Restricted Use Files.
  11. Paul Fronstin and Stephen A. Woodbury, How Many Americans Have Lost Jobs with Employer Health Coverage During the Pandemic? (Commonwealth Fund, Oct. 2020); and Sara R. Collins, Gabriella N. Aboulafia, and Munira Z. Gunja, As the Pandemic Eases, What Is the State of Health Care Coverage and Affordability in the U.S.? Findings from the Commonwealth Fund Health Care Coverage and COVID-19 Survey, March–June 2021 (Commonwealth Fund, July 2021).
  12. Sara R. Collins, “Unless Congress Acts, Recent Gains in Insurance Coverage Could Reverse,” To the Point (blog), Commonwealth Fund, Apr. 21, 2022.
  13. Matthew Buettgens and Andrew Green, What Will Happen to Medicaid Enrollees’ Health Coverage After the Public Health Emergency? (Urban Institute, Mar. 2022).
  14. D. Keith Branham et al., Projected Coverage and Subsidy Impacts If the American Rescue Plan’s Marketplace Provisions Sunset in 2023 (Office of the Assistant Secretary for Planning and Evaluation, U.S. Department of Health and Human Services, Mar. 23, 2022).
  15. Rhea K. Farberman et al., The Impact of Chronic Underfunding on America’s Public Health System: Trends, Risks, and Recommendations, 2020 (Trust for American’s Health, Apr. 2020).
  16. The White House, “American Pandemic Preparedness: Transforming Our Capabilities,” Sept. 2021.
  17. Sara Berg, “Social Media Networks Must Crack Down on Medical Misinformation,” American Medical Association, June 15, 2021.
  18. Eric K. Wei, Theodore Long, and Mitchell H. Katz, “Nine Lessons Learned from the COVID-19 Pandemic for Improving Hospital Care and Health Care Delivery,” JAMA Internal Medicine 181, no. 9 (July 2021): 1161–63.
  19. Baumgartner and Radley, “Overdose Deaths Surged,” 2022.
  20. Commonwealth Fund Task Force on Payment and Delivery System Reform, Health Care Delivery System Reform: Six Policy Imperatives (Commonwealth Fund, Nov. 2020).
  21. Dania Palanker and Nia Denise Gooding, What Four States Are Doing to Advance Health Equity in Marketplace Insurance Plans (Commonwealth Fund, Apr. 2022).
  22. Jodie G. Katon et al., Policies for Reducing Maternal Morbidity and Mortality and Enhancing Equity in Maternal Health: A Review of the Evidence (Commonwealth Fund, Nov. 2021).
  23. David C. Radley et al., Achieving Racial and Ethnic Equity in U.S. Health Care: A Scorecard of State Performance (Commonwealth Fund, Nov. 2021).
  24. Sara Rosenbaum, “Expanding Health Coverage to the Poorest Residents of States That Have Not Expanded Medicaid,” To the Point (blog), Commonwealth Fund, Feb. 1, 2022.
  25. Sarah Sugar et al., Medicaid Churning and Continuity of Care: Evidence and Policy Considerations Before and After the COVID-19 Pandemic (ASPE Office of Health Policy, Apr. 12, 2021).
  26. Linda J. Blumberg, John Holahan, and Jason Levitis, How Auto-Enrollment Can Achieve Near-Universal Coverage: Policy and Implementation Issues (Commonwealth Fund, June 2021).

Publication Details

Date

Contact

David C. Radley, Senior Scientist, Tracking Health System Performance, The Commonwealth Fund

[email protected]

Citation

David C. Radley, Jesse C. Baumgartner, and Sara R. Collins, 2022 Scorecard on State Health System Performance: How Did States Do During the COVID-19 Pandemic? (Commonwealth Fund, June 2022). https://doi.org/10.26099/3127-xy78